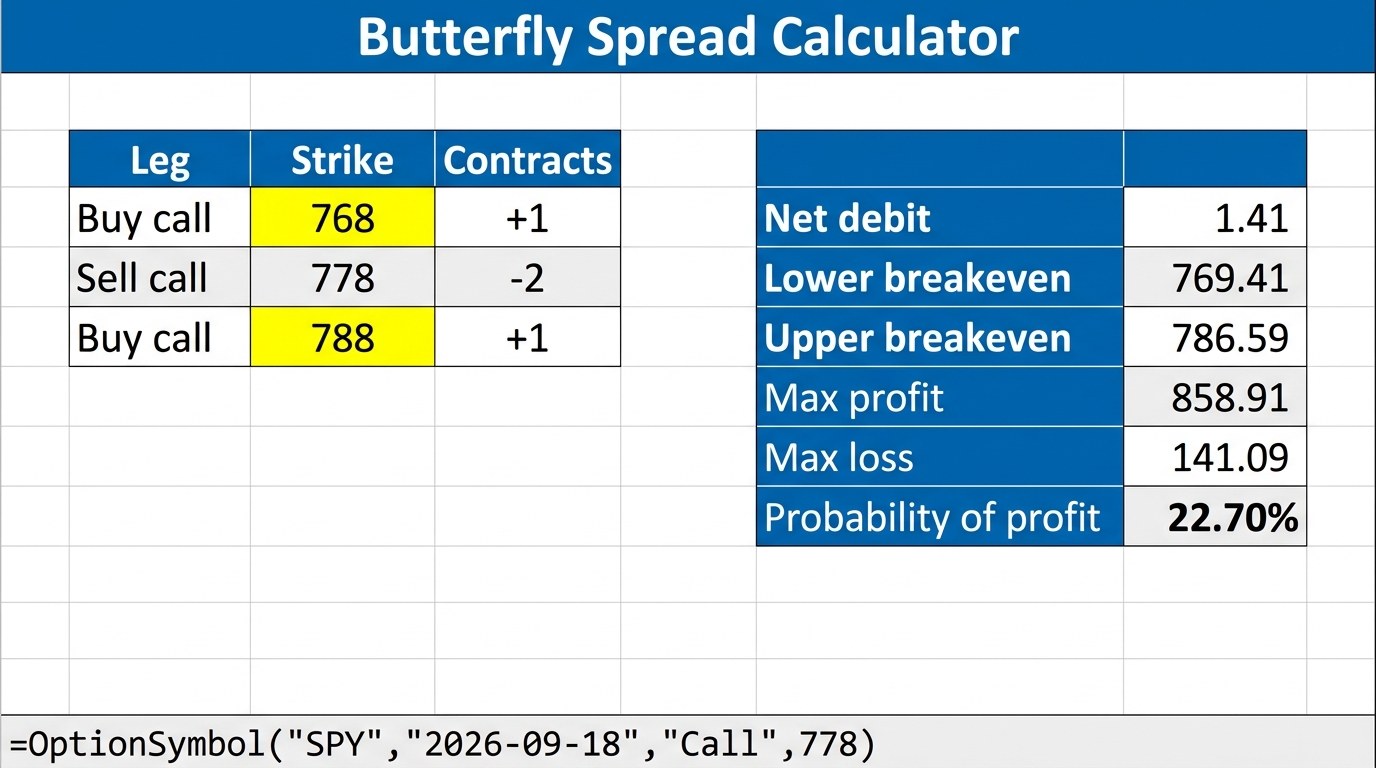
Butterfly spread calculator arithmetic is genuinely simple. Three strikes, three premiums, one net debit, two breakevens, and a maximum profit that only lands if the underlying finishes sitting exactly on the middle strike. It fits on a napkin, and almost every calculator on the internet gets those four numbers right.
The hard part is the input nobody asks about. A butterfly needs three option prices, and the option market quotes a different implied volatility at every strike. Most calculators offer one volatility box. That single design decision is where the answer goes wrong, and this guide measures exactly how far.
Every figure below comes from one live SPY option chain, priced on 2026-08-15 with the underlying at $776.34 and 34 days left to the 2026-09-18 expiration.
Butterfly spread calculator: the full board on one position
| Item | Lower wing | Body | Upper wing |
|---|---|---|---|
| Strike | 768 | 778 | 788 |
| Contracts | +1 | -2 | +1 |
| Quote source | 768 put | 778 call | 788 call |
| Bid and ask width | $0.06 | $0.09 | $0.08 |
| Width as a share of its own price | 0.7% | 0.8% | 1.2% |
| Open interest | 957 | 2,715 | 1,323 |
| Implied volatility | 13.397% | 12.536% | 11.775% |
| Output | Value |
|---|---|
| Net debit at the midpoint | $141.09 |
| Net debit at the natural | $157.09 |
| Lower breakeven | 769.41 |
| Upper breakeven | 786.59 |
| Maximum profit | $858.91 |
| Maximum loss | $141.09 |
| Reward to risk | 6.09 to 1 |
| Probability of finishing inside the profit zone | 24.51% |
| Probability of finishing within $1 of the body | 2.68% |
| Net delta | -1.50 |
| Net gamma | -0.1480 |
| Net vega | -$10.46 per volatility point |
| Net theta | +$1.79 per day |
Read the implied volatility row first. The three legs of this single position carry 13.397%, 12.536% and 11.775%. They are not the same number, they are not close to the same number, and the spread between the wings is 1.62 volatility points across twenty points of strike. A calculator with one volatility box has to pick one of those three and pretend the other two do not exist.
What one volatility box actually costs
Here is the test. Take twelve butterflies on the same chain, same expiration, same ten point wings, and move the body strike from 750 up to 805. Price each one twice. First at the market, using each leg's own implied volatility. Then with a single volatility applied to all three legs, which is what a one input calculator does.
| Body strike | Net debit | Reward to risk | Probability of profit | Expected value at market prices | Expected value with one volatility |
|---|---|---|---|---|---|
| 750 | $59.50 | 15.81 | 11.55% | +$0.21 | +$30.48 |
| 755 | $75.00 | 12.33 | 14.11% | +$0.26 | +$28.18 |
| 760 | $92.00 | 9.87 | 16.97% | +$0.32 | +$22.85 |
| 765 | $112.00 | 7.93 | 20.30% | +$0.39 | +$12.12 |
| 770 | $120.78 | 7.28 | 20.92% | +$0.42 | +$9.49 |
| 775 | $126.06 | 6.93 | 23.71% | +$0.43 | +$6.94 |
| 780 | $149.78 | 5.68 | 25.01% | +$0.52 | -$17.93 |
| 785 | $164.50 | 5.08 | 27.59% | +$0.57 | -$37.23 |
| 790 | $159.00 | 5.29 | 26.79% | +$0.55 | -$39.40 |
| 795 | $148.50 | 5.73 | 25.14% | +$0.51 | -$39.06 |
| 800 | $131.50 | 6.60 | 22.88% | +$0.45 | -$33.88 |
| 805 | $110.00 | 8.09 | 19.59% | +$0.38 | -$25.17 |
The second to last column is the truth. A position bought at its own market price has an expected value of exactly zero in present value terms, because the price is by definition the discounted expected payoff. The few cents showing up there are the financing on the premium between now and expiration, and nothing else. Every one of these twelve butterflies is fairly priced, because each one is priced at what it costs.
The last column is the fiction. Feed the same twelve positions through a single volatility and they appear to range from a $30.48 edge to a $39.40 loss. That is a $69.88 swing, on positions whose real expected values differ by 36 cents. The pattern is not random either. Every butterfly below the forward looks like a bargain and every butterfly above it looks like a trap, which is exactly the shape a downward sloping volatility skew imposes when you delete it.
If your calculator has an expected value column and one volatility input, that column is measuring your input, not the market.
Why the butterfly is the structure that exposes this
A butterfly is not just three options that happen to be in the same trade. It is a specific mathematical object. Buy one call at $K$ minus $w$, sell two at $K$, buy one at $K$ plus $w$, and you have built the second difference of the call price with respect to strike. Divide by $w$ squared and you have a numerical second derivative.
That matters because the second derivative of the call price across strikes is not a free parameter. Breeden and Litzenberger showed in 1978 that it is the risk neutral probability density of the underlying at expiration, scaled by the discount factor. In plain terms:
The price of a butterfly is the market's own probability that the underlying finishes near the body strike.
Not an analogy. An identity. Take the debit, divide it by the square of the wing width, divide again by the discount factor, and the number you get is a probability density. Multiply that by the wing width and you have the probability of finishing inside the bucket.
That is why the volatility smile cannot be ignored on this particular structure. A butterfly measures the curvature of the smile, because curvature is what a second difference is. Apply one volatility to all three legs and you have set the curvature to whatever a flat line implies, which deletes the only quantity the position is made of.
On this chain the flat volatility price came out at $132.28 against a true $141.09, an $8.82 gap, or 6.25% of the position's cost. As a cross check, integrating the payoff against a flat volatility lognormal density gave an expected value of -$8.35, which agrees with the $8.82 price gap to within half a dollar. That agreement is worth doing in any spreadsheet you build, because it separates a genuine modelling gap from an arithmetic bug.
One result here is worth stating because it runs against intuition. The butterfly's percentage pricing error is not the largest on the chain. The 778 and 788 vertical spread, built from two of these same three legs, was mispriced by 13.87% under a flat volatility against the butterfly's 6.25%. The reason is precise: a vertical prices the slope of the smile and a butterfly prices its curvature, and over adjacent strikes on an equity index the slope is steep while the curvature is mild. The measured curvature across these three strikes was only 0.0999 volatility points. The butterfly is not the most volatility sensitive structure. It is the one whose entire value is made of the term that a flat model sets to zero.
Reading the calculator as a probability distribution
Once you accept the identity, the calculator changes character. Price a butterfly at every body strike on the chain and you have extracted the market's whole distribution.
| Body strike | Butterfly price | Market density | One volatility density | Ratio | Probability within five points |
|---|---|---|---|---|---|
| 660 | $3.00 | 0.000301 | 0.000002 | 174.46 | 0.30% |
| 680 | $3.50 | 0.000351 | 0.000035 | 10.15 | 0.35% |
| 700 | $6.50 | 0.000652 | 0.000355 | 1.84 | 0.65% |
| 720 | $15.50 | 0.001555 | 0.001971 | 0.79 | 1.56% |
| 740 | $38.50 | 0.003863 | 0.006202 | 0.62 | 3.86% |
| 760 | $92.00 | 0.009232 | 0.011568 | 0.80 | 9.23% |
| 775 | $126.06 | 0.012650 | 0.013418 | 0.94 | 12.65% |
| 785 | $164.50 | 0.016507 | 0.012835 | 1.29 | 16.51% |
| 800 | $131.50 | 0.013195 | 0.009790 | 1.35 | 13.20% |
| 820 | $45.50 | 0.004566 | 0.004760 | 0.96 | 4.57% |
| 840 | $8.00 | 0.000803 | 0.001576 | 0.51 | 0.80% |
| 860 | $1.00 | 0.000100 | 0.000365 | 0.27 | 0.10% |
Two checks make this trustworthy before you read a single row. Sum the non overlapping buckets across the sampled range and the market density integrates to 0.9920, against a true 1.0000. That one number validates the strike spacing, the discounting and the quote handling in a single step. Second, the forward solved from put and call parity at two different strikes agreed to 4.7 cents, and at the anchor strike the call and the put solved to the same implied volatility to fifteen decimal places. If either check fails, nothing downstream is worth reading.
Now the shape. The market's distribution peaks at 785, above the 777.74 forward, while the single volatility model peaks at 775. The market carries visibly less probability than the flat model through the 720 to 775 region, and then vastly more in the far left tail, where the ratio runs from 1.84 at 700 to 10.15 at 680 to 174 at 660. That is the crash premium in equity index options, priced and visible, and it is the reason the mid left region has to give mass up. A single volatility model cannot produce that shape at any input value you choose. It has one parameter and the shape needs three.
The maximum profit is a point, not an outcome
Every butterfly calculator prints a maximum profit. This one prints $858.91. The number is real, and the probability attached to it is close to zero, because the maximum is collected at exactly one price out of a continuum.
The honest columns are these. The probability of finishing anywhere inside the profit zone between 769.41 and 786.59 is 24.51%. The probability of finishing within one dollar of the body strike is 2.68%, or roughly one time in thirty seven. Within fifty cents it is 1.34%, roughly one time in seventy five. The reward to risk ratio of 6.09 to 1 is quoted against the far end of that distribution, not against anything you should expect.
There is a second, sharper version of the same problem, and it is the single most misread feature of the structure. Suppose you are right. Suppose the underlying goes to the body strike and sits there. Here is what the position is worth on the way.
| Days remaining | Butterfly value | Profit or loss | Share of the maximum |
|---|---|---|---|
| 34 (entry) | $138.39 | -$2.70 | -0.31% |
| 21 | $172.43 | +$31.34 | 3.65% |
| 14 | $207.88 | +$66.79 | 7.78% |
| 7 | $285.19 | +$144.10 | 16.78% |
| 3 | $410.21 | +$269.11 | 31.33% |
| 1 | $602.82 | +$461.72 | 53.76% |
| 0 | $1,000.00 | +$858.91 | 100.00% |
Perfect prediction, held for twenty of the thirty four days, pays 7.78% of the maximum. Held to the final day it pays 53.76%. The entire remaining value arrives in the last session, because the value of a butterfly is the market's probability that the underlying stays put, and with time on the clock that probability is never high. The maximum profit number is not a target you can manage toward. It is the value of a position that has already expired.
This is the answer to the most common complaint about the structure, which is that the underlying went exactly where the trader wanted and the position barely moved. It behaved correctly. The payoff diagram everyone looks at is the expiration line, and the expiration line is the only day it is true.
Choosing the strikes
Wing width is the other lever, and it trades the same currency in the opposite direction.
| Wing width | Strikes | Net debit | Breakevens | Max profit | Max loss | Reward to risk | Probability of profit |
|---|---|---|---|---|---|---|---|
| 5 | 773 / 778 / 783 | $35.31 | 773.35 to 782.65 | $464.69 | $35.31 | 13.16 | 12.40% |
| 10 | 768 / 778 / 788 | $141.09 | 769.41 to 786.59 | $858.91 | $141.09 | 6.09 | 22.70% |
| 15 | 763 / 778 / 793 | $318.87 | 766.19 to 789.81 | $1,181.13 | $318.87 | 3.70 | 30.84% |
| 20 | 758 / 778 / 798 | $562.16 | 763.62 to 792.38 | $1,437.84 | $562.16 | 2.56 | 37.09% |
| 25 | 753 / 778 / 803 | $861.44 | 761.61 to 794.39 | $1,638.56 | $861.44 | 1.90 | 41.80% |
Reward to risk falls from 13.16 to 1.90 down that table while the probability of profit rises from 12.40% to 41.80%. They move inversely and in near lockstep, and the reason is the identity again. The reward to risk ratio of a butterfly is the market's probability rewritten as a ratio. Ranking butterflies by reward to risk is ranking them by how unlikely they are to pay, which is why the narrowest, most attractive looking spread on that table is also the one least likely to work.
The same trap appears in the body placement table further up. The cheapest butterfly there was the 750 body at $59.50 with a 15.81 reward to risk, and an 11.55% chance of finishing in its profit zone.
The quote hygiene that changes the price
One implementation detail moves the number more than most modelling choices, and it is easy to get wrong.
At every strike below the forward, the call is in the money, and the in the money call book quotes wide. The 768 call on this chain quoted $16.89 bid against $19.48 ask, a $2.59 spread, or 14.2% of its own midpoint. The 768 put, which is out of the money at the same strike, quoted $8.27 against $8.33, six cents wide, or 0.7%. Those two contracts are linked by put and call parity, so they carry the same information, but only one of them carries it accurately.
Build the butterfly straight off the call book and the midpoint debit comes to $158.50. Build it from the out of the money contract at each strike and convert with parity and you get $141.09. That is a 12.3% difference in the entry price of the position, and it is not a bid and ask crossing cost. It is the midpoint itself being unreliable, because the midpoint of a stale two dollar wide quote is not a price. The natural cost tells the same story: $301.00 off the raw call book against $157.09 built from out of the money legs.
The rule is simple. At each strike, quote the contract that is out of the money, and convert it to its call equivalent with parity. The workbook does this with a single conditional, and it is the difference between a calculator that agrees with your broker and one that does not.
Building the butterfly spread calculator in Excel with MarketXLS
Every option level function needs a contract symbol, and OptionSymbol builds it from the underlying, the expiration, the type and the strike.
=OptionSymbol($B$4,$B$5,"Call",$B$6)
With the symbol in hand, the quotes come directly.
=Bid("@SPY  260918C00778000")
=Ask("@SPY  260918C00778000")
=QM_OpenInterest("@SPY  260918C00778000")
=OPT_DaysToExpiration("@SPY  260918C00778000")
The out of the money rule becomes one conditional per leg. Below the forward it quotes the put and adds the parity adjustment, above the forward it quotes the call directly.
=IF(B25<$B$16,
    Bid(OptionSymbol($B$4,$B$5,"Put",B25))+EXP(-$B$8*$B$15/365)*($B$16-B25),
    Bid(OptionSymbol($B$4,$B$5,"Call",B25)))
Each leg then solves its own implied volatility from its own price, which is the whole point of the exercise. Note the argument order, because the dividend yield sits between the rate and the volatility.
=opt_ImpliedVolatility($B$14,F25,$B$5,"Call",B25,$B$8,$B$9)
The Greeks take the same eight arguments and net across the position in the 1, -2, 1 ratio.
=(opt_Delta($B$14,F25,$B$5,"Call",B25,$B$8,$B$9)
 -2*opt_Delta($B$14,F26,$B$5,"Call",B26,$B$8,$B$9)
 +opt_Delta($B$14,F27,$B$5,"Call",B27,$B$8,$B$9))*100*$B$10
Swap opt_Delta for opt_Gamma, opt_Vega, opt_Theta or opt_Rho and the same pattern gives the rest. A long butterfly comes out short gamma and short vega, which is the numerical statement that it wants nothing to happen.
The forward is worth its own cell rather than using the spot price, because every probability in the workbook depends on it.
=$B$14*EXP(($B$8-$B$9)*$B$15/365)
The probability of profit is then two normal distribution calls against the breakevens. NORMSDIST is the legacy name and it avoids the _xlfn prefix problem that breaks these formulas in some workbooks.
=NORMSDIST((LN($B$16/($B$34))-0.5*$B$17^2*($B$15/365))/($B$17*SQRT($B$15/365)))
-NORMSDIST((LN($B$16/($B$35))-0.5*$B$17^2*($B$15/365))/($B$17*SQRT($B$15/365)))
Wrap each strike reference in its own parentheses. Writing LN($B$16/$B$6-1) divides first and subtracts second, which quietly returns a wrong probability rather than an error.
Reference volatility and positioning come from the underlying level functions.
=ImpliedVolatility30d("SPY")
=ImpliedVolatilityRank1y("SPY")
=StockVolatilityThirtyDays("SPY")
=opt_PutCallOIRatio("SPY","2026-09-18")
=earnings_date("SPY")
=Strikes("SPY","2026-09-18")
=ExpirationNext("SPY",4)
What is inside the template
Six sheets, driven from one set of yellow input cells on the dashboard.
How To Use explains each sheet and names the three inputs that decide everything: the underlying and expiration, the body strike, and the wing width.
Main Dashboard holds the inputs, the three leg quotes with their bid and ask widths and open interest, each leg's own implied volatility, the net debit at the midpoint and at the natural, both breakevens, maximum profit, maximum loss, reward to risk, the probability of profit and the probability of finishing within a dollar of the body, plus the four net Greeks.
Scenario Analysis carries the expiration payoff across ten underlying prices, and below it the pre expiry value table that shows what the position is worth at each point in its life with the underlying pinned on the body strike.
Strike Selection runs the wing width sweep and the body placement sweep, each with cost, reward to risk and probability of profit, and the two expected value columns that separate the market's answer from a single volatility answer.
Position Sizing converts a portfolio value and a risk budget into contracts, using the debit as the maximum loss.
Implied Density is the Breeden and Litzenberger sheet. It prices a butterfly at every body strike, converts each to a probability density, compares it against the single volatility density, and carries the three validation checks at the bottom.
Download the templates:
- Static Version (with MarketXLS formula reference) - Pre-filled with the 2026-08-15 chain used throughout this guide
- MarketXLS Formula Version - Live-updating formulas
Frequently asked questions
How do you calculate the breakeven on a butterfly spread?
A butterfly has two. The lower breakeven is the lower strike plus the net debit per share, and the upper breakeven is the upper strike minus the net debit per share. On the position above, 768 plus 1.41 gives 769.41 and 788 minus 1.41 gives 786.59. The profit zone between them is always the total width of the structure minus twice the debit.
What is the maximum profit on a butterfly spread?
The wing width minus the net debit, collected only if the underlying finishes exactly on the body strike. Here that is 10.00 minus 1.41, or $858.91 per contract. Treat it as the ceiling rather than the expectation, because the probability of finishing within a dollar of the body on this chain was 2.68%.
Why is my butterfly not making money when the stock is at my strike?
Because a butterfly holds its value until expiration and then delivers almost all of it at once. With the underlying pinned exactly on the body strike, the position above was worth 7.78% of its maximum with 14 days left and 53.76% with one day left. Nothing is wrong. The payoff diagram describes the expiration day only.
Does a butterfly spread calculator need the implied volatility?
For the debit, the breakevens and the maximum profit, no, because those come from the strikes and the quoted prices. For the probability columns, the Greeks and any expected value, yes, and it needs a separate volatility for each strike. Using one volatility across all three legs moved the apparent expected value of twelve butterflies on this chain across a $69.88 range while their real expected values differed by 36 cents.
Should I build a butterfly from calls, puts or as an iron butterfly?
Put and call parity makes them the same position with the same payoff, so the choice is an execution question rather than a payoff question. Quote each leg from the contract that is out of the money at that strike. On this chain the in the money 768 call quoted $2.59 wide against six cents for the out of the money 768 put at the same strike, and building the position off the raw call book moved its midpoint price by 12.3%.
What does the price of a butterfly actually tell me?
The market's probability that the underlying finishes near the body strike. Divide the debit by the square of the wing width and by the discount factor and the result is a probability density. Priced across every strike on this chain, those densities integrated to 0.9920, which is a distribution.
The bottom line
A butterfly spread calculator that reports the net debit, both breakevens and the maximum profit is doing the arithmetic correctly and answering the smallest question in the trade. Those figures follow from the strikes and the quotes, and they would be the same for anyone.
The questions worth a spreadsheet are the ones underneath. Whether each leg was priced at its own volatility or at a single number borrowed from the middle strike. Whether the quotes came from the out of the money book or from the wide in the money side, which moved the entry price by 12.3% here. How likely the maximum profit is, which was 2.68% against a reward to risk ratio that reads 6.09 to 1. And what the position is actually worth on the days you hold it, which was under eight percent of the maximum at the halfway point even with the underlying sitting exactly where it needed to be.
The identity underneath all of it is the useful part. A butterfly is the second difference of the call price across three strikes, so its price is the market's own probability density at the body. That means a correctly built butterfly calculator is not just pricing a position. It is reading the distribution the option market is quoting, and it can check its own work, which is what the 0.9920 integration and the 4.7 cent forward agreement in the template are for.
None of this is a recommendation to trade a butterfly or any other structure. It is a framework for pricing one honestly before deciding, and the output is only as good as the volatility surface behind it, which is why the workbook validates its own inputs before it reports a single probability.
Build it once in Excel with live MarketXLS formulas and it reprices every morning against whatever the chain is quoting. Explore the full function library at MarketXLS, or book a demo to see the options tooling applied to your own positions.