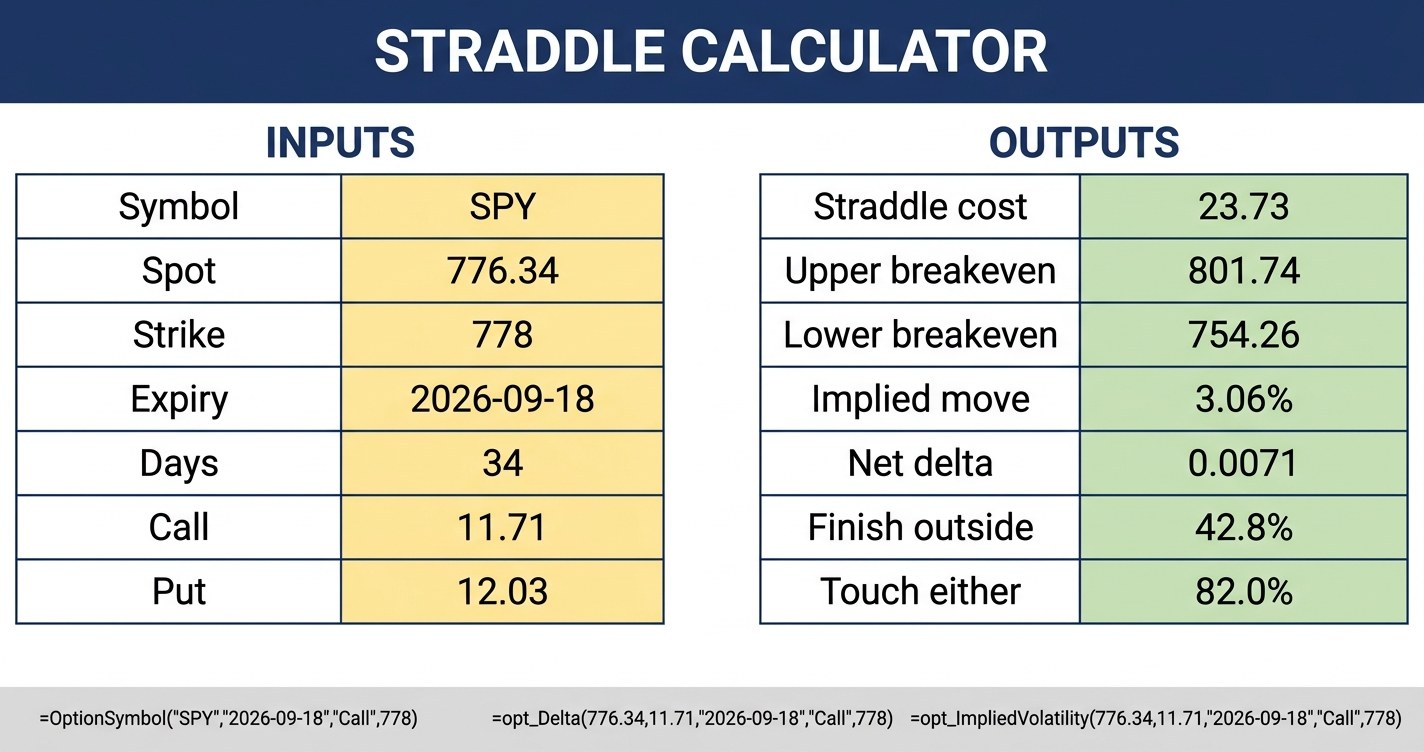
Straddle calculator arithmetic ends about ten seconds after it begins. Add the call price to the put price at the same strike and you have the cost. Everything that decides whether the position works sits past that addition: what the two legs actually fill at, how much directional risk a supposedly neutral structure carries, and whether the move the market has priced in is bigger or smaller than the move the stock normally makes.
This guide builds a straddle calculator that answers four questions the payoff diagram cannot. What does the position actually cost to open, as opposed to what the mid prices suggest. How much directional exposure does a supposedly neutral straddle carry. How often does the position reach a breakeven, as opposed to finishing past one. And is the implied move you are paying for larger or smaller than the move this underlying has historically delivered.
Every figure below comes from one live SPY option chain, priced on 2026-08-15 with the underlying at $776.34 and 34 calendar days to the 2026-09-18 expiration.
Straddle calculator: the numbers that matter
| Output | Value | Where it comes from |
|---|---|---|
| Straddle cost, per share | $23.73 | call mid $11.71 plus put mid $12.03 |
| Straddle cost, per contract | $2,373.50 | cost per share times 100 |
| Upper breakeven | $801.74 | strike $778 plus $23.73 |
| Lower breakeven | $754.26 | strike $778 less $23.73 |
| Implied move | 3.06% | straddle cost divided by spot |
| Move required up | 3.27% | spot to upper breakeven |
| Move required down | 2.84% | spot to lower breakeven |
| Net delta | 0.0071 | call delta plus put delta |
| Net theta | negative $34.66 per day | both legs decay together |
| Probability of finishing outside a breakeven | 42.77% | risk neutral, at expiration |
| Probability of touching a breakeven | 82.02% | at any time before expiration |
Two rows in that table are worth pausing on. The move required up and the move required down are not equal, because the strike is not the spot price. And the last two rows differ by a factor of almost two, which is the single largest gap between how a straddle is usually described and how it actually behaves.
The five inputs a straddle calculator needs
A long straddle buys a call and a put at the same strike and the same expiration. The position profits if the underlying moves far enough in either direction. That description is complete enough to build the calculator and incomplete enough to lose money on.
The inputs are the underlying price, the strike, the expiration date, the call price and the put price. Everything else is derived. In the workbook these sit in yellow cells on the first sheet, and every other number on every other sheet keys off them.
The one input that deserves care is the price you enter for each leg. A calculator fed mid prices reports a position you cannot open at that price. The section on the strike ladder below puts a dollar figure on that difference, and on this chain the figure ranges from $7 to $134 per contract depending purely on which strike you pick.
Straddle cost, breakevens and the implied move
The core arithmetic is short. The cost is the sum of the two legs. The breakevens sit one full premium above and below the strike, because at expiration only one leg has value, and that leg has to cover the cost of both.
Straddle cost      = call price + put price
Upper breakeven    = strike + straddle cost
Lower breakeven    = strike - straddle cost
Implied move (pct) = straddle cost / spot price
For the 778 strike that gives a cost of $23.73, an upper breakeven of $801.74 and a lower breakeven of $754.26. The band between them is $47.47 wide, which is 6.11% of the underlying price. The position loses money anywhere inside that band and loses its entire premium only at exactly $778.
The implied move deserves a precise definition, because it is used loosely. The at-the-money straddle price divided by the spot price is the market's price for the size of the coming move, expressed as a percentage, over the life of that expiration. It is not a forecast of direction and it is not a one standard deviation figure, although it lands close to one for short horizons.
Note the asymmetry in the required moves. The upper breakeven at $801.74 is 3.27% above spot. The lower breakeven at $754.26 is 2.84% below spot. Those differ because the strike sits $1.66 above the spot price, so the put leg starts closer to being useful than the call leg does. A calculator that reports one implied move figure and stops has quietly hidden a 43 basis point difference between the two directions you are betting on.
The at-the-money straddle is not delta neutral
The most common sentence written about straddles is that they are direction neutral. On this chain that sentence is measurably false, and the size of the error is easy to miss because it hides inside a number that looks small.
Take the strike nearest the spot price, 776. Its net delta is 0.0601. That looks like rounding noise until you convert it. One contract controls 100 shares, so the position carries 6.01 shares of stock exposure. At $776.34 per share, that is $4,666 of directional exposure inside a position that costs $2,405 to open. The straddle carries stock exposure worth 1.94 times its own premium, in a single direction, before the underlying has moved at all.
Three different strikes matter here, and they are not the same strike:
| Reference point | Strike | What it is |
|---|---|---|
| Nearest the spot price | 776 | where most calculators default |
| The forward price | 777.70 | spot adjusted for carry to expiration |
| Delta neutral | 778.27 | where call delta and put delta actually cancel |
The delta neutral strike sits above both the spot price and the forward price. It sits above the spot price because of carry, and it sits above the forward price because of skew, since the put leg trades at a slightly higher implied volatility than the call leg at strikes away from the money. If your intent is a neutral position, the arithmetic points at 778, not at 776.
This is also why the straddle calculator has to solve the forward price rather than assume it. Put call parity gives the forward directly from any strike where both a call and a put quote:
Forward = strike + (call mid - put mid) x exp(rate x years)
On this chain, using the tightest quoted strikes near the money, that solves to a forward of $777.695 against a spot of $776.34, which implies a carry of 2.158% against a headline dividend yield near 1%. Feeding the headline yield into the model instead of the solved carry shifts every implied volatility and every delta in the workbook.
There is a free check that catches a wrong forward immediately. At the strike used to solve it, the call and the put must return the identical implied volatility, because put call parity is model free. In the workbook that check returns 12.566% and 12.589% at the 778 strike, a gap of 0.022 volatility points. When that gap opens to a full volatility point, the forward is wrong, not the market.
Which strike to straddle, and what each choice costs
A straddle calculator that accepts one strike answers a question you have not finished asking. The strike ladder below prices the same structure across the chain, with mid cost against the cost of actually crossing the spread on both legs.
| Strike | Mid cost | Natural cost | Crossing cost | Lower BE | Upper BE | Implied move | Net delta |
|---|---|---|---|---|---|---|---|
| 760 | $30.43 | $31.76 | 4.39% | 729.58 | 790.42 | 3.92% | 0.4144 |
| 770 | $25.94 | $26.30 | 1.39% | 744.06 | 795.94 | 3.34% | 0.2072 |
| 775 | $24.25 | $24.33 | 0.31% | 750.75 | 799.25 | 3.12% | 0.0860 |
| 778 | $23.73 | $23.81 | 0.32% | 754.26 | 801.74 | 3.06% | 0.0071 |
| 780 | $23.55 | $23.63 | 0.32% | 756.45 | 803.55 | 3.03% | negative 0.0470 |
| 790 | $25.00 | $25.92 | 3.68% | 765.00 | 815.00 | 3.22% | negative 0.3163 |
| 795 | $26.34 | $27.68 | 5.09% | 768.66 | 821.34 | 3.39% | negative 0.4518 |
Three separate observations fall out of that table.
The cheapest straddle by mid cost is at 780, not at the strike nearest spot and not at the delta neutral strike. Cost, neutrality and the implied move each bottom out at a different strike, so a calculator that picks the strike for you is picking one of them and discarding the other two.
The crossing cost is not a rounding item. At 778 it is 0.32%, which is $8 per contract. At 795 it is 5.09%, which is $134 per contract on a position whose entire theoretical edge is measured in tenths of a percent. The straddles that cost the most to enter are the ones built from a deep in the money leg, because in the money option books quote wide. Building the straddle from strikes near the money keeps both legs in the tight part of the book.
The implied move is not one number. It reads 3.03% at the 780 strike and 3.92% at the 760 strike, on the same underlying, on the same day, for the same expiration. Anyone quoting "the implied move" without naming a strike has chosen one silently.
The odds a straddle calculator should show
Here is the part that changes how the position is managed rather than how it is priced.
At expiration, the 778 straddle needs the underlying outside $754.26 or $801.74. The risk neutral probability of that is 42.77%. That is the hold-to-expiry win rate, and it is the number most probability calculators report.
But almost nobody holds a straddle to expiration. The relevant question for a position you might close early is different: at any point in the next 34 days, does the underlying reach one of those breakevens at all. That is a barrier probability, not a terminal one, and it is much higher.
| Event | Probability |
|---|---|
| Finish above $801.74 | 20.83% |
| Finish below $754.26 | 21.84% |
| Finish outside either breakeven | 42.77% |
| Touch $801.74 at any time | 41.07% |
| Touch $754.26 at any time | 44.38% |
| Touch both breakevens | 3.43% |
| Touch either breakeven | 82.02% |
The position reaches a breakeven 82.02% of the time and ends past one 42.77% of the time. The ratio is 1.92. Roughly half of all straddles that trade through a breakeven at some point give that level back before expiration.
Two implementation notes, because this calculation is easy to get wrong in ways that look right.
The two touch probabilities do not add. Adding 41.07% and 44.38% gives 85.45%, which double counts the 3.43% of paths that touch both barriers. Subtracting the overlap returns exactly 82.02%. Any barrier probability above 100% is a sign the reflection term has the wrong sign, and that error is common enough to be worth an explicit check in the workbook.
A simulation that only looks at daily closes undercounts touches badly, because the underlying can trade through a level intraday and close back inside. Running 400,000 paths with a Brownian bridge correction, so a crossing between two closes still counts, returns 41.07% on the upper barrier against a closed form value of 41.06%. Without the correction the same simulation returns 35.66%, which understates the touch rate by more than five percentage points.
The implied move does not scale with the square root of time
A widely used shortcut estimates the implied move as implied volatility multiplied by the square root of the time remaining. It is a reasonable approximation inside a single expiration. Across expirations it breaks, and the direction of the error is consistent.
| Expiration | Days | Straddle cost | Implied move | Implied vol | Move divided by sqrt(T) |
|---|---|---|---|---|---|
| 2026-08-21 | 6 | $7.43 | 0.96% | 9.36% | 7.465 |
| 2026-08-28 | 13 | $12.54 | 1.61% | 10.73% | 8.556 |
| 2026-09-04 | 20 | $16.57 | 2.13% | 11.43% | 9.115 |
| 2026-09-11 | 27 | $19.78 | 2.55% | 11.75% | 9.368 |
| 2026-09-18 | 34 | $23.73 | 3.06% | 12.58% | 10.017 |
| 2026-09-30 | 46 | $27.95 | 3.60% | 12.75% | 10.143 |
| 2026-10-16 | 62 | $34.50 | 4.44% | 13.56% | 10.781 |
| 2026-11-20 | 97 | $46.87 | 6.04% | 14.74% | 11.710 |
| 2026-12-18 | 125 | $54.37 | 7.00% | 15.05% | 11.966 |
If the square root rule held, the final column would be flat. It rises 60.3% from the 6 day expiration to the 125 day expiration, because implied volatility itself rises with maturity on this chain.
The practical consequence is concrete. The 6 day straddle costs $7.43. Scaling that by the square root of 34 divided by 6 predicts $17.69 for the 34 day straddle. The 34 day straddle actually costs $23.73, which is 34.2% more than the shortcut predicts. Running the same test from 27 days out to 125 days understates the longer straddle by 27.7%.
Pricing each expiration from its own chain, rather than scaling one of them, removes this error entirely. It costs two extra formulas.
Is this straddle expensive, and against what
A straddle calculator that reports cost and breakevens has told you the price. It has not told you whether the price is high. That requires comparing the implied move against the moves this underlying has actually produced over the same horizon.
The 34 calendar day expiration covers roughly 23 trading days. Measuring every 23 trading day window in SPY over the last ten years gives the comparison directly.
| Measure | Value |
|---|---|
| Implied move, 34 calendar days | 3.06% |
| Median realized move, same horizon | 3.16% |
| Mean realized move, same horizon | 3.75% |
| Implied volatility | 12.58% |
| Realized volatility, last 23 sessions | 12.96% |
| Variance risk premium | negative 0.39 volatility points |
Implied volatility currently sits below trailing realized volatility, which is the reverse of the long run tendency. On this specific chain, on this specific day, the option market is charging slightly less for the coming month than the underlying delivered over the last one.
Settling the 778 straddle against each historical window makes that concrete:
| Backtest measure | Overlapping windows | Independent windows |
|---|---|---|
| Number of windows | 2,491 | 109 |
| Win rate | 50.18% | 56.88% |
| Mean profit or loss per share | $4.71 | $4.84 |
| Median profit or loss per share | $0.15 | $3.15 |
Both win rates exceed the 42.77% the pricing model implies, which is what a negative variance risk premium looks like when it shows up in outcomes. Three cautions belong next to those numbers, and a calculator that reports the backtest without them is overselling it.
Overlapping windows share days, so 2,491 of them are not 2,491 pieces of evidence. There are only 109 independent 23 day periods in ten years, which is a small sample for a distribution with tails this heavy.
The mean and the median disagree violently in the overlapping sample. The mean gain is $4.71 per share, or 19.84% of the premium paid. The median gain is $0.15 per share, or 0.65%. The typical window returns approximately nothing.
The result is a tail. The best 5% of windows contribute 86.0% of the total gains in the sample. Remove them and the average result falls from 19.84% of premium to 2.92%. The best single window returned $239.69 per share against a maximum possible loss of $23.71. A long straddle is a position whose entire historical record lives in a handful of months, which is a description of its risk, not a recommendation about it.
MarketXLS implementation
Every formula below is a live MarketXLS function. The contract level functions need a QuoteMedia option symbol, which OptionSymbol builds from four arguments.
=OptionSymbol("SPY","2026-09-18","Call",778)
=OptionSymbol("SPY","2026-09-18","Put",778)
Wrap that symbol to pull the quote for each leg:
=Bid($B$16)
=Ask($B$16)
=QM_OpenInterest($B$16)
=OPT_DaysToExpiration($B$16)
=OPT_IntrinsicValue($B$16,$B$6)
=OPT_TimeValue($B$16,$B$11,$B$6)
The Greeks take positional arguments rather than a contract symbol. The full argument order is spot price, market option price, expiry date, option type, strike, risk free rate, dividend yield and sigma, with the last three optional:
=opt_Delta($B$6,$B$11,$B$8,"Call",$B$7,$B$10)
=opt_Gamma($B$6,$B$11,$B$8,"Call",$B$7,$B$10)
=opt_Vega($B$6,$B$11,$B$8,"Call",$B$7,$B$10)
=opt_Theta($B$6,$B$11,$B$8,"Call",$B$7,$B$10)
=opt_ImpliedVolatility($B$6,$B$11,$B$8,"Call",$B$7,$B$10)
For the context that tells you whether the current implied move is high for this underlying:
=ImpliedVolatility30d("SPY")
=ImpliedVolatilityRank1y("SPY")
=StockVolatilityThirtyDays("SPY")
=opt_PutCallOIRatio("SPY","2026-09-18")
=earnings_date("SPY")
And to drive the strike and expiration selection from the chain itself rather than by hand:
=ExpirationNext("SPY",2)
=Strikes("SPY","2026-09-18")
ImpliedVolatility30d, ImpliedVolatilityRank1y and StockVolatilityThirtyDays return decimals, so format those cells as percentages rather than multiplying by 100. More detail on the option functions sits in the MarketXLS function documentation, and the options analysis features page covers the wider option toolset.
What is inside the template
The workbook has six sheets and ships in two versions.
- Straddle Calculator. The input block, the contract symbols, the cost and breakeven block, and the Greeks. Net delta is converted into share exposure and into a multiple of the premium, so the neutrality question is answered in the units you actually carry.
- Strike Ladder. Twelve strikes priced side by side with mid cost, natural cost, crossing cost, both breakevens, the implied move and net delta.
- Odds. Finish probabilities and touch probabilities, with the simulation settings and the closed form cross check printed next to them.
- Term Structure. Nine expirations with the square root of time test in the final column.
- History Check. The implied move against ten years of realized moves, plus the backtest with the overlapping and independent samples reported separately.
- Formula Reference. Every MarketXLS function used, with the exact call syntax as text you can copy into a cell.
The sample workbook carries the figures from the 2026-08-15 chain as static values, so it opens and calculates correctly without the add-in installed. The template workbook replaces the market data cells with live functions and recalculates against the current chain.
Common mistakes this calculator catches
Reading one breakeven. A straddle has two, and they are not equidistant from the spot price unless the strike happens to equal it. On this chain the up move required is 3.27% and the down move required is 2.84%.
Assuming the position is neutral. The straddle at the strike nearest spot carried stock exposure worth 1.94 times its own premium. Neutral is a strike you have to choose, not a property of the structure.
Pricing at the mid. Mid cost and natural cost differ by $8 per contract at the money and by $134 per contract seven strikes away. The difference is entirely a function of which strike you built from.
Confusing finishing with touching. 42.77% and 82.02% answer different questions. Using the first to evaluate a position you intend to manage actively understates how often a decision point will appear.
Scaling one expiration to another. The square root of time shortcut understated the 34 day straddle by 34.2% when scaled up from the 6 day straddle on this chain.
FAQ
How do you calculate a straddle in Excel?
Add the call price and the put price to get the cost. Add that cost to the strike for the upper breakeven and subtract it for the lower breakeven. Divide the cost by the spot price for the implied move. In the template the cost is =B11+B12, the upper breakeven is =B7+B23 and the implied move is =B23/B6.
What is the breakeven on a long straddle? There are two. The upper breakeven is the strike plus the total premium paid, and the lower breakeven is the strike less the total premium. On the worked example, a $778 strike with a $23.73 cost breaks even at $801.74 and $754.26.
Is an at-the-money straddle delta neutral? Not usually. The strike nearest the spot price on this chain carried a net delta of 0.0601, which is 6.01 shares of exposure per contract. The delta neutral strike was 778.27, above both the spot price of $776.34 and the forward price of $777.70.
What is the implied move on a straddle? It is the at-the-money straddle price divided by the underlying price, which gives the percentage move the option market is pricing over the life of that expiration. It varies by strike, reading 3.03% at the 780 strike and 3.92% at the 760 strike on the same chain.
How often does a long straddle actually win? On the worked example the risk neutral probability of finishing outside a breakeven was 42.77%. Settled against ten years of SPY history over the same horizon, the same structure finished outside a breakeven in 50.18% of overlapping windows and 56.88% of independent ones. The mean result was strongly positive and the median was close to zero, because the gains concentrate in a small number of periods.
What is the difference between a straddle and a strangle? A straddle uses one strike for both legs. A strangle uses a lower strike for the put and a higher strike for the call, which lowers the cost and widens the distance between the two breakevens. The same calculator handles both once the two legs are allowed different strikes.
The bottom line
A straddle calculator that stops at cost and breakevens has answered the easiest question and left the expensive ones open. The strike you build from changes the entry cost by up to 5% of the premium. The strike nearest the spot price is not the neutral one. The probability of reaching a breakeven is nearly double the probability of finishing past one, and that gap is where the management decisions live. The implied move you are paying does not scale between expirations the way the common shortcut says it does.
None of that requires a different model. It requires pricing each leg from its own quote, solving the forward rather than assuming it, and reporting the barrier probability alongside the terminal one. The workbook above does all three, and prints the checks that catch it when one of them is wrong.
Explore MarketXLS options analysis to build this calculator against a live chain in your own Excel.