Put option calculator math runs downward, and the direction changes every answer. A put gains as the stock falls, so breakeven sits below the strike instead of above it, and the maximum gain is capped by the stock reaching zero instead of running unlimited. How far does the stock have to fall before the contract returns anything? How much of the quote is real value and how much is time you are renting? What happens if the move you expect arrives two weeks late?
A put option calculator answers those questions. It does not tell you where the stock is going. It converts a quoted premium into the numbers that decide whether the contract does what you want it to do: breakeven, maximum loss, probability of finishing in the money, and the rate at which the position bleeds while you wait.
This guide builds one in Excel. Every figure below comes from a live AAPL put chain captured on August 15, 2026, and every formula is a real MarketXLS function. Two workbooks are linked at the end so you can drop your own contract into the same model.
Put Option Calculator: The Contract at a Glance
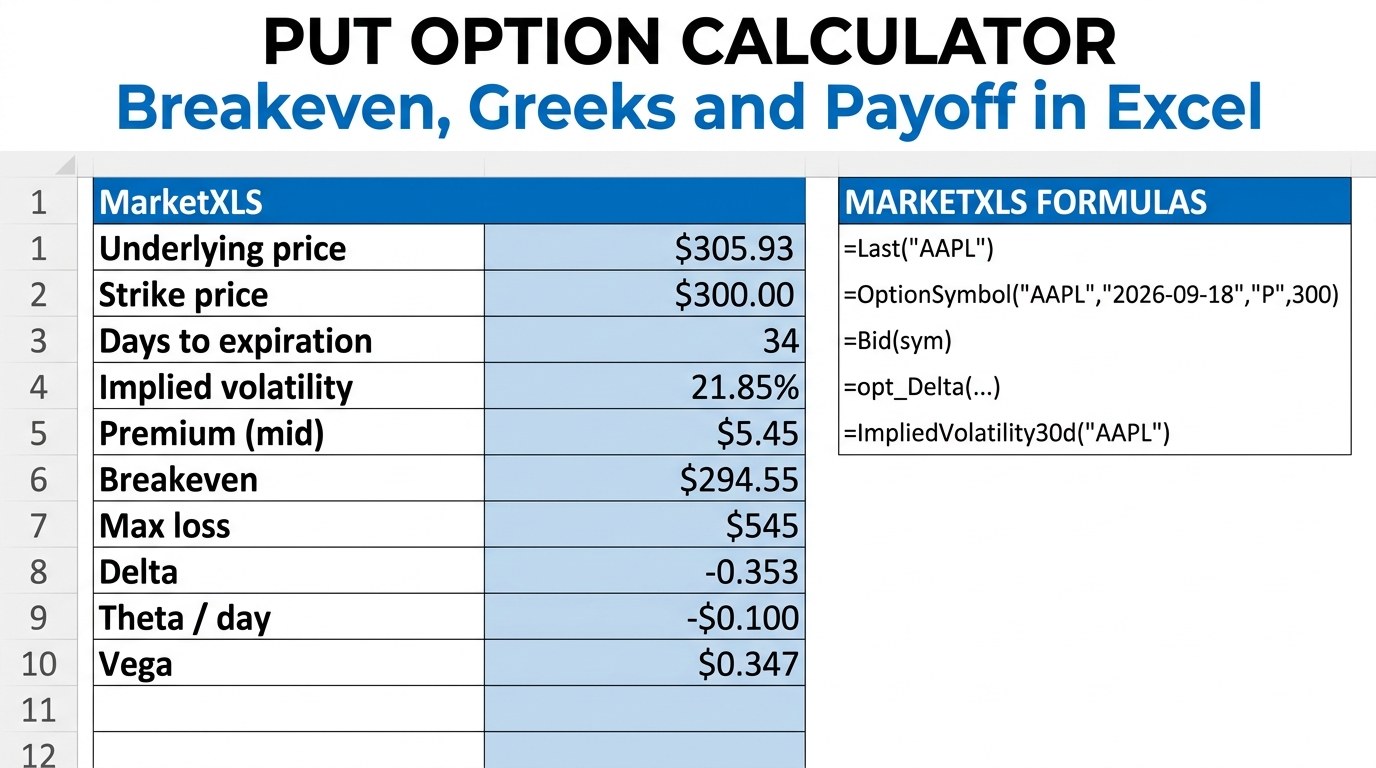
Here is the worked example used throughout this guide, an AAPL September 2026 300 put with the stock at 305.93.
| Field | Value |
|---|---|
| Underlying | AAPL at $305.93 |
| Strike | $300.00 |
| Expiration | September 18, 2026 |
| Days to expiration | 34 |
| Market bid / ask | $5.35 / $5.55 |
| Mid premium | $5.45 |
| Implied volatility | 21.85% |
| Intrinsic value | $0.00 |
| Time value | $5.45 |
| Breakeven at expiration | $294.55 |
| Move required to breakeven | -3.72% |
| Maximum loss, 1 contract | $545 |
| Maximum profit, 1 contract | $29,455 |
| Open interest | 24,216 |
Two numbers in that table do most of the work. The breakeven of $294.55 means AAPL has to fall 3.72% in 34 days before this contract returns a cent at expiration. And the time value of $5.45 is the entire premium, because the put is out of the money. There is nothing to protect. Every day that passes takes a piece of it.
What a Put Option Calculator Actually Computes
A put gives the holder the right to sell 100 shares at the strike price until expiration. That right has a price, and the price splits cleanly into two parts.
Intrinsic value is what the contract would be worth if it expired right now. For a put it is the strike minus the underlying price, floored at zero. With AAPL at $305.93 and a $300 strike, the put is out of the money and intrinsic value is $0.00.
Time value, sometimes called extrinsic value, is everything else. It is the market charging you for the possibility that the stock falls below the strike before expiration. In this contract, time value is the whole $5.45.
The calculator's job is to work out what that time value should be, and the standard tool for it is the Black-Scholes model. It takes five inputs and returns a theoretical price:
| Input | Example value | Where it comes from |
|---|---|---|
| Underlying price | $305.93 | Observable, live quote |
| Strike price | $300.00 | Observable, you choose it |
| Time to expiration | 34 days, 0.0932 years | Observable, calendar |
| Risk free rate | 4.00% | Observable, short term Treasury yield |
| Dividend yield | 0.35% | Observable, trailing yield |
| Implied volatility | 21.85% | Not observable. You supply it. |
That last row is the one worth pausing on. Five of the six inputs are handed to you by the market. Volatility is not. It is an assumption about how much the stock will move, and it is the only lever in the model that reflects an opinion rather than a fact.
You can see the effect immediately. Price this contract with the chain's quoted 21.85% volatility and Black-Scholes returns $5.04. The market is asking $5.45. Those numbers disagree because the market is trading the put at a volatility closer to 23.02%. Neither figure is wrong. Implied volatility is simply the number that reconciles the model to the market price, which is why a put option calculator should always show both.
Breakeven and the Move You Are Actually Betting On
Breakeven on a long put is the strike minus the premium paid:
Breakeven = Strike - Premium
          = $300.00 - $5.45
          = $294.55
That is 3.72% below where AAPL trades today, and it has to happen within 34 days. Not eventually. Not at some point next year. Before September 18, 2026.
This is the single most useful output of a put option calculator, because it reframes the trade honestly. You are not betting that AAPL falls. You are betting that AAPL falls more than 3.72% within five weeks. Those are very different propositions, and the second one is considerably harder.
The risk numbers are symmetrical in an unusual way:
- Maximum loss is the premium, $545 for one contract. It happens at any close at or above $300.
- Maximum profit is $29,455, reached only if AAPL goes to zero.
That maximum profit figure appears in every options textbook and it deserves a warning label. It is a mathematical boundary, not a scenario. Treating it as an expected outcome is the fastest way to misjudge a long put.
The Payoff, at Expiration and Halfway There
Most payoff diagrams show the position at expiration only. That is the least useful moment, because it is the one point in the contract's life when time value is exactly zero. Here is the same contract measured both ways, one contract bought at $5.45.
| Move in AAPL | Underlying | Value at expiry | P/L at expiry | Return | Value at day 17 | P/L at day 17 |
|---|---|---|---|---|---|---|
| -20% | $244.74 | $55.26 | +$4,981 | +914% | $54.74 | +$4,929 |
| -15% | $260.04 | $39.96 | +$3,451 | +633% | $39.45 | +$3,400 |
| -10% | $275.34 | $24.66 | +$1,921 | +353% | $24.35 | +$1,890 |
| -5% | $290.63 | $9.37 | +$392 | +72% | $11.06 | +$561 |
| -2% | $299.81 | $0.19 | -$526 | -97% | $5.48 | +$3 |
| 0% | $305.93 | $0.00 | -$545 | -100% | $3.04 | -$241 |
| +2% | $312.05 | $0.00 | -$545 | -100% | $1.53 | -$392 |
| +5% | $321.23 | $0.00 | -$545 | -100% | $0.44 | -$501 |
| +10% | $336.52 | $0.00 | -$545 | -100% | $0.03 | -$542 |
Compare the -5% row. At expiration the contract returns $392. Seventeen days in, the same 5% decline is worth $561, because the option still holds time value on top of its intrinsic value. The -2% row is starker still: a small decline is a $526 loss at expiration but roughly breakeven at the halfway point.
The lesson runs against intuition. For a long put, the expiration line is the worst case for time value, not the base case. If your thesis plays out early, you capture more than the payoff diagram suggests. If it plays out slowly, decay takes the difference. This is why exit timing matters as much as strike selection, and why a calculator that only models expiration hides half the picture.
The Greeks, and What Each One Costs You
The Greeks measure how the option's price responds when something changes. For this contract:
| Greek | Per share | Per contract | What it tells you |
|---|---|---|---|
| Delta | -0.353 | -$35.27 | The put gains about $35 for each $1 AAPL falls |
| Gamma | 0.0182 | 0.0182 | Delta itself moves 0.018 per $1 of underlying |
| Theta | -$0.100 | -$10.01 per day | The position loses about $10 every calendar day |
| Vega | $0.347 | +$34.67 | A one point rise in implied volatility adds about $35 |
| Rho | -$0.105 | -$10.52 | A one point rise in rates costs about $11 |
Read delta and theta together and you have the whole trade in two numbers. Delta is negative, so the contract pays when AAPL falls. Theta is negative too, so it loses roughly $10 a day when nothing happens. AAPL needs to fall about 28 cents a day just to offset the decay. That is the actual hurdle, and it is invisible on a quote screen.
Delta has a second use. Its absolute value is a rough approximation of the chance the option finishes in the money, so -0.353 suggests something near a 35% probability. The formal risk neutral figure from the model is 37.8%. Both are model outputs under an assumption, not forecasts, but they are a useful sanity check against how confident the trade feels.
Vega is the quiet one. At $34.67 per volatility point, a meaningful share of this premium is a position on volatility rather than direction. If AAPL falls but implied volatility collapses at the same time, the put can gain far less than delta alone implies. Buying puts into an already elevated volatility reading is how traders end up right on direction and flat on profit and loss.
Choosing a Strike: The Column Most Traders Skip
Run the calculator across the whole chain and the trade off becomes visible. Every strike below is a real quote from the same September 18, 2026 expiration.
| Strike | Mid | Cost | Breakeven | Move to breakeven | Delta | Theta/day | Theta % of premium | Spread % | Open interest |
|---|---|---|---|---|---|---|---|---|---|
| $265 | $0.45 | $45 | $264.55 | -13.5% | -0.037 | -$0.030 | -6.6% | 8.9% | 8,734 |
| $275 | $0.86 | $86 | $274.13 | -10.4% | -0.070 | -$0.044 | -5.1% | 3.5% | 10,483 |
| $285 | $1.80 | $180 | $283.20 | -7.4% | -0.140 | -$0.067 | -3.7% | 4.4% | 9,990 |
| $295 | $3.80 | $380 | $291.20 | -4.8% | -0.266 | -$0.091 | -2.4% | 2.6% | 11,623 |
| $300 | $5.45 | $545 | $294.55 | -3.7% | -0.353 | -$0.100 | -1.8% | 3.7% | 24,216 |
| $305 | $7.47 | $748 | $297.52 | -2.7% | -0.448 | -$0.101 | -1.4% | 3.3% | 6,712 |
| $315 | $13.55 | $1,355 | $301.45 | -1.5% | -0.630 | -$0.099 | -0.7% | 8.1% | 6,061 |
| $325 | $20.82 | $2,082 | $304.18 | -0.6% | -0.785 | -$0.065 | -0.3% | 6.0% | 2,757 |
The $265 put costs $45. That looks like a cheap way to be short AAPL, and the cost column is where most strike selection stops.
Look at the theta percentage column instead. That contract loses 6.6% of its own value every single day, against 1.8% for the $300 strike and 0.3% for the $325 strike. It also needs a 13.5% decline in 34 days to break even. The cheap strike is not a cheaper version of the same trade. It is a different and much harder bet, and the calculator is what makes that legible.
The spread column deserves attention too. The $265 put shows a bid ask spread of 8.9% of its mid price, and the $320 strike is worse. You pay that spread twice, once entering and once exiting, so on a thin strike the round trip can cost more than several days of decay. Open interest is the fastest liquidity check available, and the $300 strike carries more than three times the open interest of the $325 strike.
Four Ways to Use a Put, Priced Side by Side
The same calculator prices every structure built from puts. Here are four on the same underlying and expiration.
| Structure | What you do | Net cost or credit | Max profit | Max loss | Breakeven |
|---|---|---|---|---|---|
| Long put | Buy the $300 put | -$545 | $29,455 | $545 | $294.55 |
| Protective put | Own 100 shares, buy the $300 put | -$545 | Uncapped on the shares | $1,138 | $311.38 |
| Cash secured put | Sell the $295 put, set aside cash | +$380 | $380 | $29,120 | $291.20 |
| Bear put spread | Buy the $300 put, sell the $290 put | -$282 | $718 | $282 | $297.18 |
None of these is better in the abstract. They price different questions.
The long put is a directional position with a known maximum loss and a demanding breakeven. The protective put is insurance on shares you already own, so the premium behaves like a recurring cost rather than a trade, and the $1,138 maximum loss is the cost of a floor under the position. The cash secured put pays you to accept the obligation to buy, capping your gain at $380 while leaving substantial downside. The bear put spread cuts the cost of the long put from $545 to $282 by selling away the tail, which produces a 2.55 to 1 reward to risk ratio and no participation below $290.
Notice the bear put spread's breakeven of $297.18 against the long put's $294.55. Selling the $290 leg buys a closer breakeven and gives up the large decline. That is the trade, stated plainly, and it is exactly the kind of comparison a spreadsheet makes trivial and a quote screen makes hard.
Position Sizing: The Number That Surprises People
Sizing a put by premium alone understates the position badly. Here is a $250,000 portfolio at various risk budgets, buying the $300 put at $5.45.
| Percent risked | Dollar budget | Contracts | Capital deployed | Shares controlled | Notional at strike | Notional as % of portfolio |
|---|---|---|---|---|---|---|
| 0.50% | $1,250 | 2 | $1,090 | 200 | $60,000 | 24.0% |
| 1.00% | $2,500 | 4 | $2,180 | 400 | $120,000 | 48.0% |
| 2.00% | $5,000 | 9 | $4,905 | 900 | $270,000 | 108.0% |
| 3.00% | $7,500 | 13 | $7,085 | 1,300 | $390,000 | 156.0% |
A one percent risk budget buys four contracts. The premium at risk is $2,180, which sounds modest. Those four contracts control 400 shares and roughly $120,000 of notional exposure at the strike, which is 48% of the portfolio. At a three percent budget the notional exceeds the portfolio itself.
The premium is genuinely capped, so the maximum loss really is the amount deployed. But the position moves like a large short, and delta is what converts that notional into daily profit and loss swings. A put option calculator that reports only the premium tells you what you can lose. One that also reports notional and delta tells you what you are actually holding.
Building the Put Option Calculator in Excel
Everything above is reproducible in a spreadsheet using MarketXLS functions. Start with the underlying and the volatility inputs:
=Last("AAPL")                          Underlying price
=DividendYield("AAPL")                 Dividend yield, returned as a decimal
=ImpliedVolatility30d("AAPL")          30 day implied volatility, decimal
=ImpliedVolatilityRank1y("AAPL")       Where current IV sits in its one year range
=StockVolatilityThirtyDays("AAPL")     30 day realized volatility
=AverageDailyVolume("AAPL")            Liquidity check on the underlying
Every contract level function needs an option symbol rather than a ticker, and OptionSymbol builds it:
=OptionSymbol("AAPL","2026-09-18","P",300)
That returns the contract identifier, which then feeds the quote and Greek functions:
=Bid(sym)                              Live bid for the contract
=Ask(sym)                              Live ask
=QM_OpenInterest(sym)                  Open interest
=OPT_DaysToExpiration(sym)             Calendar days remaining
The Greeks take the pricing inputs directly. All five share the same argument shape, with the option type set to "P" for a put:
=opt_Delta(spot, marketPrice, expiry, "P", strike, rate, divYield, sigma)
=opt_Gamma(spot, marketPrice, expiry, "P", strike, rate, divYield, sigma)
=opt_Theta(spot, marketPrice, expiry, "P", strike, rate, divYield, sigma)
=opt_Vega(spot,  marketPrice, expiry, "P", strike, rate, divYield, sigma)
=opt_Rho(spot,   marketPrice, expiry, "P", strike, rate, divYield, sigma)
To solve for implied volatility from a market price, drop the final argument:
=opt_ImpliedVolatility(spot, marketPrice, expiry, "P", strike, rate, divYield)
Chain level context rounds it out:
=opt_PutCallOIRatio("AAPL")            Put call open interest ratio
=opt_PutCallVolRatio("AAPL")           Put call volume ratio
=ExpirationNext("AAPL",1)              Next expiration date
=Strikes("AAPL","2026-09-18")          Strike list for an expiration
=earnings_date("AAPL")                 Next earnings date
That last one matters more than it looks. An expiration that straddles an earnings date carries elevated implied volatility for a reason, and a put bought into that premium faces a volatility drop the moment the announcement passes.
If you prefer to see the model itself rather than call a Greek function, the Black-Scholes put price is straightforward in native Excel:
d1 = (LN(S/K) + (r - q + sigma^2/2) * T) / (sigma * SQRT(T))
d2 = d1 - sigma * SQRT(T)
Put = K * EXP(-r*T) * NORMSDIST(-d2) - S * EXP(-q*T) * NORMSDIST(-d1)
Both approaches appear in the template so you can check one against the other.
What Is Inside the Template
The workbook has eight sheets. Yellow cells are inputs, and every downstream sheet follows them.
- Cover and How To Use, explaining each tab and each input.
- Put Calculator, the main dashboard. Premium, intrinsic and time value split, breakeven, maximum loss and profit, all five Greeks, plus the Black-Scholes working shown step by step.
- Payoff Scenarios, profit and loss across nine underlying moves, at expiration and at the halfway point.
- Strike Ladder, the full chain with cost, breakeven, delta, theta, theta as a percent of premium, spread width and open interest, colour scaled so the trade offs stand out.
- Strategy Compare, the four structures above priced from the same chain.
- Position Sizing, converting a portfolio value and a risk budget into a contract count, with notional exposure alongside.
- Volatility Compare, implied against realized volatility across eight underlyings.
Download the templates:
- Static Version (with MarketXLS formula reference) is pre-filled with the August 15, 2026 data used in this guide. Hover any bordered cell to see the formula behind it.
- MarketXLS Formula Version contains the live formulas and refreshes whenever Excel recalculates.
The formula version needs the MarketXLS add-in to pull live data. The static version opens in any copy of Excel.
Frequently Asked Questions
How do you calculate the breakeven on a put option?
Subtract the premium paid from the strike price. A $300 put bought for $5.45 breaks even at $294.55 at expiration. For a protective put, add the premium to the share purchase price instead, because you are paying for a floor rather than betting on a decline.
Why is my put losing money when the stock is falling?
Three things can cause it. Time decay may exceed the gain from the move, which is likely if the decline is small and slow. Implied volatility may have dropped, which reduces the premium through vega even as delta helps. Or the stock has not yet fallen past your breakeven, so the contract is worth more than zero but less than you paid. The scenario sheet in the template separates these effects.
What is a good delta for buying a put?
There is no universally good delta, only a trade off. Higher absolute delta, meaning strikes closer to or above the current price, cost more and break even on a smaller move. Lower delta strikes cost less but need a much larger move and decay faster as a percentage of premium. The strike ladder table above shows the full range so you can pick against your own view rather than a rule of thumb.
Does a put option calculator predict whether a trade will be profitable?
No. It prices a contract and measures its risk under the inputs you supply. The probability figures it reports are risk neutral model outputs, not forecasts. Implied volatility in particular is an assumption you provide, not a prediction the model produces.
What is the difference between intrinsic and time value on a put?
Intrinsic value is the strike minus the underlying price, floored at zero, and it is what the contract is worth if it expires immediately. Time value is the rest of the premium. An out of the money put is entirely time value, so it decays to zero at expiration unless the stock falls below the strike.
Can I use this calculator for selling puts?
Yes. The economics invert. A cash secured put seller collects the premium as maximum profit and takes on the strike minus premium as maximum loss, and theta works in their favour rather than against. The Strategy Compare sheet prices both sides on the same chain.
The Bottom Line
A put option calculator will not tell you where a stock is heading. What it does is convert a quoted premium into the four numbers that decide whether a contract fits your view: the breakeven, the move required to reach it, the daily cost of waiting, and the real exposure the position carries.
For the AAPL put in this guide, those numbers are a $294.55 breakeven, a 3.72% required decline, roughly $10 a day of decay, and $30,000 of notional exposure per contract. None of that is visible on a quote screen showing $5.45. All of it changes how the trade should be sized and timed.
Build it once in Excel and it works for every contract afterwards. Change the ticker, the strike and the expiration, and the model reprices everything from live data.
Explore the full options function set at MarketXLS, review plans on the pricing page, or book a demo to see the options tools walked through live.
This article is educational and is not investment advice. Options carry significant risk, including the total loss of the premium paid. Tickers and figures are used to demonstrate how the calculations work, not to recommend any position.