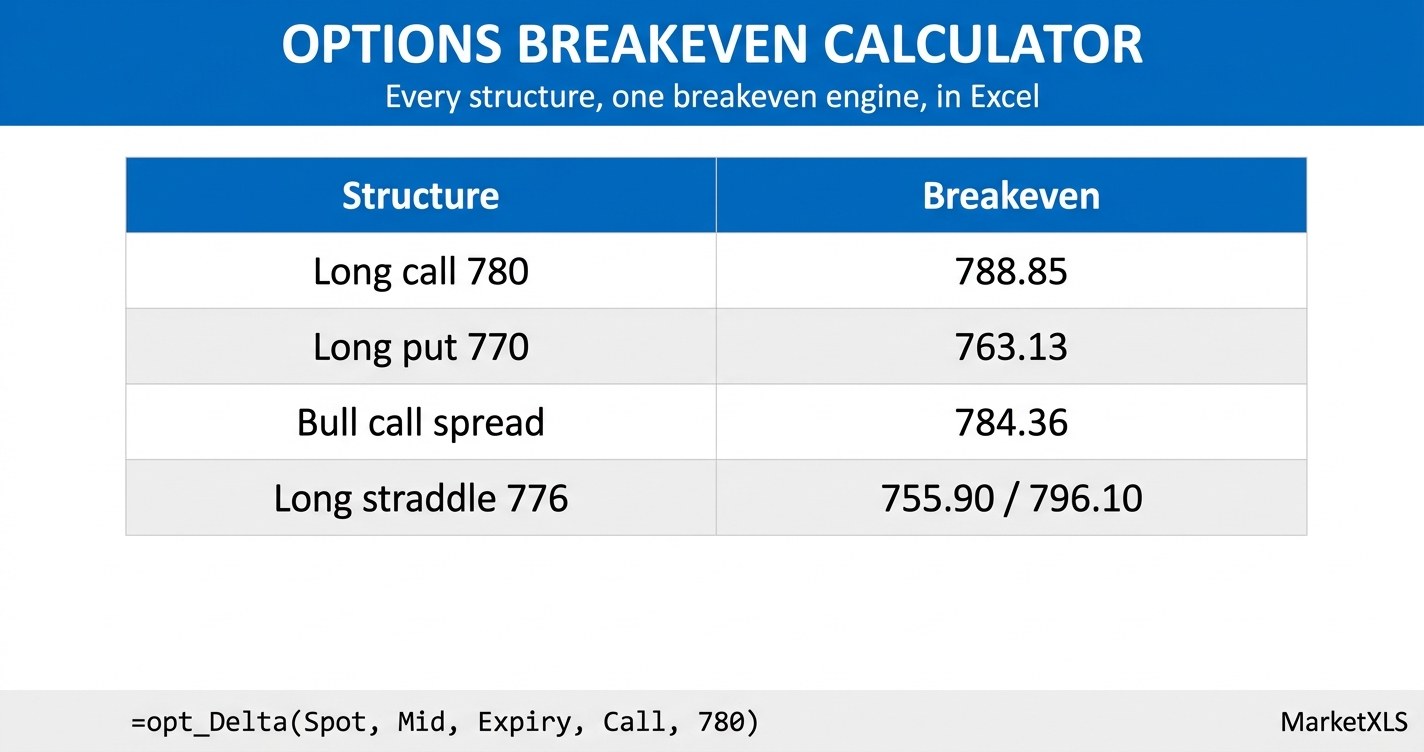
Options breakeven calculator output is the number that turns a premium into a price. A quote of $8.40 means nothing standing on its own. Breakeven converts it into a level the underlying has to reach before that $8.40 comes back, which is the form the question was always in. Most calculators answer it for a single long call and stop there. That is a problem, because a second leg changes the shape of the arithmetic, and holding a position for less than its full life stops the answer being a single number at all.
This guide builds a calculator that takes eight structures at once and reports the breakeven for each, along with the move required, the worst case, and the odds. Every figure below comes from one live SPY option chain, priced on 2026-08-15 with the underlying at $776.34 and 27 days left to the 2026-09-11 expiration.
Options breakeven calculator: eight structures on one board
| Structure | Legs | Net per contract | Breakeven | Move required | Max profit | Max loss | Finish past breakeven |
|---|---|---|---|---|---|---|---|
| Long call | Buy 780 call | $884.50 debit | 788.85 | +1.61% | Unlimited | -$884.50 | 31.8% |
| Long put | Buy 770 put | $686.50 debit | 763.13 | -1.70% | $76,313.50 | -$686.50 | 30.0% |
| Covered call | Buy 100 shares, sell 790 call | $449.00 credit | 771.85 | -0.58% | $1,815.00 | -$77,185.00 | 59.0% |
| Cash secured put | Sell 765 put | $552.00 credit | 759.48 | -2.17% | $552.00 | -$75,948.00 | 73.7% |
| Bull call spread | Buy 780 call, sell 790 call | $435.50 debit | 784.36 | +1.03% | $564.50 | -$435.50 | 39.2% |
| Bull put spread | Sell 765 put, buy 755 put | $187.50 credit | 763.12 | -1.70% | $187.50 | -$812.50 | 70.0% |
| Long straddle | Buy 776 call and 776 put | $2,010.00 debit | 755.90 / 796.10 | -2.63% / +2.55% | Unlimited | -$2,010.00 | 46.1% |
| Long strangle | Buy 790 call, buy 765 put | $1,001.00 debit | 754.99 / 800.01 | -2.75% / +3.05% | Unlimited | -$1,001.00 | 38.4% |
Premiums are the bid-ask midpoint on each leg. Maximum profit and maximum loss are per contract on 100 shares. The last column is the modeled probability of finishing on the profitable side of the breakeven at expiration.
Read down the breakeven column and one thing should stand out immediately. The numbers cluster. The six single-breakeven structures span just 29.37 points, from 759.48 to 788.85, which is under four percent on an underlying trading at $776.34. Breakeven, on its own, barely distinguishes these positions. What separates them sits in the columns on either side.
What an options breakeven calculator actually computes
Breakeven is the underlying price at which the position returns exactly what it cost, at expiration, before tax. For a single long option it is arithmetic you can do in your head:
- Long call breakeven equals strike plus premium. The 780 call at $8.845 breaks even at 788.845.
- Long put breakeven equals strike minus premium. The 770 put at $6.865 breaks even at 763.135.
For anything with more than one leg, the shortcut stops working. A bull call spread does not break even at the long strike plus the long premium. It breaks even at the long strike plus the net debit, because the short leg paid part of the bill. Buying the 780 call at $8.845 and selling the 790 call at $4.490 leaves a net debit of $4.355, so the breakeven is 784.355, not 788.845.
The general rule that covers every case is simpler than the special cases: the breakeven is wherever the expiration payoff crosses zero. The calculator in the template solves for that crossing directly rather than pattern matching on strategy names. That one design choice is why it handles a position with two breakevens, one breakeven, or none at all without any special handling. The payoff is piecewise linear, so every root sits between two strikes, and a bisection between the kinks finds all of them.
Same breakeven, opposite bet
Look at two rows in the table above.
The long 770 put breaks even at 763.13. The bull put spread, selling the 765 put and buying the 755 put, breaks even at 763.12. Those are the same number to the penny, from real market prices, with no cherry picking.
They are also opposite bets.
The long put makes money below 763.13. The bull put spread makes money above 763.12. One position wants the market down, the other wants it up, and a breakeven calculator that reports only a price would show them as identical.
This is the single most useful thing to understand about breakeven, and it is why the template carries a direction column next to every breakeven. A breakeven is a boundary, not a target. It tells you where the profit region starts. It does not tell you which side of the boundary that region is on, and it does not tell you how wide it is. The long put has an enormous profit region below its breakeven, running all the way to zero. The bull put spread has a profit region that stops earning anything extra above 765 and caps at $187.50.
The move required is the number that matters
Converting breakeven into a percentage move is what makes positions comparable:
| Structure | Breakeven | Move required | Days available | Implied volatility at that strike |
|---|---|---|---|---|
| Covered call | 771.85 | -0.58% | 27 | 12.30% |
| Bull call spread | 784.36 | +1.03% | 27 | 11.21% |
| Long call | 788.85 | +1.61% | 27 | 10.90% |
| Long put | 763.13 | -1.70% | 27 | 13.24% |
| Cash secured put | 759.48 | -2.17% | 27 | 13.71% |
| Long straddle | 796.10 | +2.55% | 27 | 11.62% |
| Long strangle | 800.01 | +3.05% | 27 | 10.43% |
Now the positions separate. The long call needs a 1.61 percent move in 27 days. The long strangle needs 3.05 percent to the upside, nearly double, because it paid for two contracts instead of one. The covered call has a negative move required, meaning it is already past breakeven the moment it is opened, which is exactly what selling premium against stock buys you.
The last column is where the discipline comes in. The option market is quoting roughly 11 to 14 percent annualized volatility on these strikes. Over 27 days that scales to a one standard deviation move of about 3.2 percent. A structure that needs 3.05 percent is asking for something close to a full standard deviation. A structure that needs 0.58 percent is asking for noise. Neither is right or wrong, but you should know which one you are buying.
The breakeven that moves before expiration
Every breakeven quoted so far assumes you hold to expiration. Almost nobody does.
Sell earlier and the position still has time value in it, so it returns to your entry cost at a lower underlying price than the expiration math suggests. The breakeven is not a number. It is a curve that slides toward the expiration value as the clock runs out.
Here is the long 780 call, bought at $8.845:
| Days remaining | Breakeven price | Move required | Gap to expiration breakeven |
|---|---|---|---|
| 27 (entry day) | 776.34 | 0.00% | 12.50 |
| 21 | 779.06 | +0.35% | 9.78 |
| 14 | 782.41 | +0.78% | 6.44 |
| 7 | 785.95 | +1.24% | 2.90 |
| 3 | 787.95 | +1.50% | 0.89 |
| 0 (expiration) | 788.85 | +1.61% | 0.00 |
On entry day the breakeven is the current price, by definition: you could sell the contract back for what you paid. With 14 days left the position recovers its cost at 782.41, which is 6.44 points below the expiration breakeven. Only on the final day do the two converge.
The same effect is larger on a straddle, because a straddle has two premiums decaying at once:
| Days remaining | Straddle upper breakeven | Move required | Gap to expiration breakeven |
|---|---|---|---|
| 27 (entry day) | 776.34 | 0.00% | 19.76 |
| 21 | 786.08 | +1.25% | 10.02 |
| 14 | 791.47 | +1.95% | 4.63 |
| 7 | 794.85 | +2.38% | 1.25 |
| 3 | 795.84 | +2.51% | 0.26 |
| 0 (expiration) | 796.10 | +2.55% | 0.00 |
The practical reading is that the expiration breakeven is the hardest version of the target, not the base case. A long option holder who plans to close early is working against a nearer breakeven than the quoted one. That is a genuine advantage of closing early, and it is the mirror image of the usual warning about time decay. Decay hurts the position value, and it simultaneously drags the breakeven up toward the expiration number. Both statements are true at once.
Note that this curve depends on implied volatility staying put. If volatility falls while you hold, the pre-expiration breakeven moves higher than the table shows. That is why the template exposes volatility as an input rather than burying it.
What a nearer breakeven costs
The bull call spread breaks even at 784.36. The plain long call breaks even at 788.85. Selling the 790 call against the 780 call pulls the breakeven down by 4.49 points and cuts the cost of the position roughly in half, from $884.50 to $435.50.
Nothing is free. Here is what the two structures do across a price ladder at expiration:
| Underlying at expiration | Move | Long call profit | Bull call spread profit |
|---|---|---|---|
| 729.76 | -6% | -$884.50 | -$435.50 |
| 745.29 | -4% | -$884.50 | -$435.50 |
| 760.81 | -2% | -$884.50 | -$435.50 |
| 776.34 | 0% | -$884.50 | -$435.50 |
| 791.87 | +2% | +$302.18 | +$564.50 |
| 807.39 | +4% | +$1,854.86 | +$564.50 |
| 822.92 | +6% | +$3,407.54 | +$564.50 |
The spread wins on small moves and on every scenario where nothing happens. It loses badly on the large move, where the long call keeps compounding and the spread is frozen at its cap. The spread buys a nearer breakeven and a smaller loss by selling the entire right tail.
This is the trade that a breakeven number alone hides. If your view is "up a little", the spread is a better expression of it. If your view is "up a lot", paying for the further breakeven is the point.
Commissions move the breakeven, and multi-leg structures pay twice
Commissions are small, and they are not zero. At $0.65 per contract per leg, opening and closing a single-leg position costs $1.30, which is $0.013 per share on 100 shares:
| Structure | Legs | Breakeven | Breakeven after round-trip fees |
|---|---|---|---|
| Long call | 1 | 788.845 | 788.858 |
| Long put | 1 | 763.135 | 763.122 |
| Bull call spread | 2 | 784.355 | 784.381 |
| Long straddle | 2 | 755.900 / 796.100 | 755.874 / 796.126 |
Two things are worth noting. Fees always push the breakeven away from you, which is why the long put's breakeven falls while the long call's rises. And a two-leg structure pays the fee twice, so its breakeven moves twice as far. On a single contract this is rounding error. On a fifty-lot of four-leg positions traded monthly, it stops being rounding error, which is why the fee is a yellow input cell in the template rather than an assumption baked into a formula.
Finishing past breakeven versus touching it
Two different questions get confused constantly. The probability of finishing past the breakeven at expiration is not the probability of touching it at some point along the way. For a position you intend to manage actively, the second number is often the more relevant one.
| Structure | Breakeven | Finish past it | Touch it at any point |
|---|---|---|---|
| Long call | 788.85 | 31.8% | 61.1% |
| Long put | 763.13 | 30.0% | 61.9% |
| Bull call spread | 784.36 | 39.2% | 75.2% |
| Cash secured put | 759.48 | 73.7% | 54.1% |
| Long straddle | 755.90 / 796.10 | 46.1% | 47.1% / 44.7% |
The gap is large and it is systematic. A driftless underlying touches a barrier roughly twice as often as it finishes beyond it, which is why the long call shows 31.8 percent to finish and 61.1 percent to touch. If your plan is to hold to expiration, use the first column. If your plan is to take profits when the position first turns green, the second column describes your actual odds far better.
These probabilities are modeled under a lognormal distribution using the implied volatility of the listed strike nearest each breakeven, which respects the volatility skew instead of forcing one at-the-money number onto a far-away strike. They are a model output and nothing more. Real distributions have fatter tails than the model assumes.
Building the options breakeven calculator in Excel with MarketXLS
The calculator needs four inputs per leg: the underlying price, the strike, the expiration, and the premium. MarketXLS supplies all four live.
Start by building the contract symbol, which every contract level function needs:
=OptionSymbol("SPY","2026-09-11","Call",780)
Then pull the two sides of the market and take the midpoint, which is the price the breakeven should be built on:
=Bid(OptionSymbol("SPY","2026-09-11","Call",780))
=Ask(OptionSymbol("SPY","2026-09-11","Call",780))
=AVERAGE(B10:C10)
The underlying comes from a single call:
=QM_Last("SPY")
With those in place the breakevens are ordinary Excel. For a long call, where B4 holds the strike and D10 the mid:
=B4+D10
For a vertical spread, where D10 is the long premium and D11 the short premium:
=B4+(D10-D11)
For the move required, comparing against the live underlying in C4:
=(E10-$C$4)/$C$4
For the straddle, the two breakevens are the strike plus and minus the combined debit:
=B4-(D10+D11)
=B4+(D10+D11)
The Greeks and the implied volatility come from the opt_ family, which takes positional arguments rather than a contract symbol. The argument order is spot, market option price, expiration, option type, strike, and then optional rate, dividend yield and sigma:
=opt_Delta($C$4,D10,"2026-09-11","Call",780)
=opt_Theta($C$4,D10,"2026-09-11","Call",780)
=opt_Vega($C$4,D10,"2026-09-11","Call",780)
=opt_ImpliedVolatility($C$4,D10,"2026-09-11","Call",780)
For the time value still sitting in a contract, which is what the pre-expiration breakeven curve is really measuring:
=OPT_TimeValue(OptionSymbol("SPY","2026-09-11","Call",780),D10,QM_Last("SPY"))
=OPT_DaysToExpiration(OptionSymbol("SPY","2026-09-11","Call",780))
And for context on whether the current volatility level is high or low by this underlying's own standards:
=ImpliedVolatility30d("SPY")
=ImpliedVolatilityRank1y("SPY")
=StockVolatilityThirtyDays("SPY")
Why the implied volatility column decides your model breakeven
The expiration breakeven is arithmetic and is always right. The pre-expiration breakeven, the Greeks and every probability are model outputs, and a model is only as good as the volatility behind it.
There is a trap here that is worth spelling out, because it is easy to walk into. Many data sources publish an implied volatility per contract that was solved from the contract's last traded price under an undisclosed forward. Those numbers do not reprice the current mid. Feed them into a breakeven model and the model quietly disagrees with the market you are actually trading.
On this chain the damage was systematic:
| Contract | Traded mid | IV solved from the mid | Published IV | Price at the published IV | Error |
|---|---|---|---|---|---|
| 780 call | $8.845 | 11.53% | 12.35% | $9.536 | +$0.691 |
| 776 call | $11.110 | 11.86% | 12.81% | $11.903 | +$0.793 |
| 770 put | $6.865 | 12.48% | 11.43% | $6.034 | -$0.831 |
| 776 put | $8.990 | 11.96% | 10.76% | $7.992 | -$0.998 |
Every call is overpriced and every put is underpriced. That sign flip is the signature of a forward mismatch, not of random noise. An error of $0.69 on the 780 call shifts its breakeven by 0.69 points, which is over five percent of the entire 12.5 point move the position needs, introduced by nothing but a bad volatility input.
The fix is mechanical and takes three steps:
- Solve the forward from put-call parity at the most liquid strike where both a call and a put trade. With the 775 strike,
F = K + (call mid - put mid) / exp(-rT), which gave a forward of 778.2047 against a spot of 776.34. - Back the carry out of that forward. Here it came to 0.8469 percent, which is not the headline dividend yield. Using the headline figure is precisely what breaks the model.
- Re-solve every leg's implied volatility from its own midpoint under that forward.
There is a free check at the end. At the anchor strike the call and the put must solve to the same implied volatility, because put-call parity ties them together. On this chain both solved to 12.0316 percent with a difference of zero. If those two numbers disagree, the forward is wrong and every model breakeven built on it is wrong too. The template runs this check on its own sheet so you can see it pass or fail before trusting anything downstream.
Position sizing from the breakeven, not the premium
The most common sizing error in options is treating the premium as the risk. It is the risk for a long option, and it is nowhere near the risk for anything you sell.
| Structure | Net per contract | Maximum loss per contract |
|---|---|---|
| Long call | $884.50 debit | $884.50 |
| Bull call spread | $435.50 debit | $435.50 |
| Bull put spread | $187.50 credit | $812.50 |
| Cash secured put | $552.00 credit | $75,948.00 |
The bull put spread collects $187.50 and can lose $812.50, which is the ten point width of the strikes less the credit. The cash secured put collects $552.00 and is obligated on $76,500 of stock. Sizing either one off the credit received understates the exposure by a factor of four in the first case and by a factor of well over a hundred in the second.
The template's sizing sheet divides a risk budget by maximum loss, never by premium. Set the account size and the percentage you are willing to risk, and it returns a contract count per structure.
What is inside the template
Both workbooks carry seven sheets:
- How To Use explains each sheet and lists the MarketXLS functions used.
- Breakeven Calculator is the main board. Yellow cells are inputs for the underlying, expiration, days remaining and commission. All eight structures reprice from them, and a leg pricing block below shows bid, ask, mid, implied volatility and delta per contract.
- Pre-Expiry Breakeven builds the moving breakeven curve for the long call and the straddle across six points in the position's life.
- Scenario Analysis runs every structure across a seven step price ladder and flags the direction each one profits in.
- Strategy Comparison puts all eight side by side on breakeven, move required, maximum profit, maximum loss, probability, and what each structure gives up.
- Position Sizing converts a risk budget into contracts using maximum loss.
- IV Consistency Check shows the solved forward, the implied carry, the anchor strike parity test, and the mispricing introduced by using a published implied volatility instead of one solved from the mid.
The sample workbook is filled with the static values used throughout this article, dated 2026-08-15, with the MarketXLS formula shown next to each figure. The template workbook replaces every data cell with a live formula.
Download the templates:
- Static Version (with MarketXLS formula reference) - Pre-filled with the data above
- MarketXLS Formula Version - Live-updating formulas
If you are pricing a single directional contract rather than comparing structures, the put option calculator for Excel covers breakeven, delta and decay strike by strike on the bearish side, and the iron condor calculator handles the four leg case where both breakevens matter at once.
Frequently asked questions
What is the breakeven formula for a call option?
Strike price plus the premium paid per share. A 780 call bought for $8.845 breaks even at 788.845 at expiration. Add commissions divided by 100 to get the real number, which brings it to 788.858 at $0.65 per contract round trip.
What is the breakeven formula for a put option?
Strike price minus the premium paid per share. A 770 put bought for $6.865 breaks even at 763.135. Commissions push it down rather than up, to 763.122, because a put needs the underlying lower.
Why does my spread have a different breakeven than the long leg alone?
Because the short leg paid part of the cost. A spread's breakeven uses the net debit or net credit, not the premium of one leg. Buying the 780 call at $8.845 and selling the 790 call at $4.490 gives a net debit of $4.355 and a breakeven of 784.355, which is 4.49 points nearer than the 788.845 of the long call by itself.
Can an options position have two breakevens?
Yes. Any structure that profits from movement in either direction has two. A 776 straddle bought for a combined $20.10 breaks even at 755.90 on the downside and 796.10 on the upside, and loses money everywhere between them. Iron condors, strangles and butterflies all have two as well.
Does breakeven tell me whether a position is bullish or bearish?
No, and this is the most common misreading. In the table above the long 770 put breaks even at 763.13 and the 765/755 bull put spread breaks even at 763.12. The prices are identical and the positions are opposites. The long put needs the market below that level and the spread needs it above. Always read the breakeven together with the direction the position profits in.
Is the breakeven different if I close the position early?
Yes, and it is nearer. Before expiration the position still holds time value, so it returns to its entry cost at a lower underlying price. The 780 call in this example breaks even at 782.41 with 14 days left, against 788.845 at expiration. The two converge on the final day. This assumes implied volatility is unchanged, so a volatility drop while you hold pushes the early breakeven back up.
The bottom line
An options breakeven calculator earns its keep when it stops treating breakeven as one number. The expiration breakeven is arithmetic, it is easy, and it is the least informative version of the answer. The useful calculator reports the breakeven alongside the direction the position profits in, the percentage move required, how that move compares to what the option market is pricing, how the breakeven shifts if you close early, and what the position actually loses when the trade goes wrong.
The eight structures priced here break even inside a band of under four percent, and they behave nothing alike. One needs a 0.58 percent move against it to fail and another needs a 3.05 percent move in its favor to work. Two of them share a breakeven price to the penny and bet in opposite directions. All of that is invisible if the calculator prints a single number and stops.
None of this is a recommendation to trade any of these structures. It is a framework for pricing them honestly before you decide, and the arithmetic is only as good as the inputs, which is why the template checks its own volatility surface before it reports anything.
Build it once in Excel with live MarketXLS formulas and it reprices every morning against whatever the chain is quoting. Explore the full function library at MarketXLS, or book a demo to see the options tooling applied to your own positions.