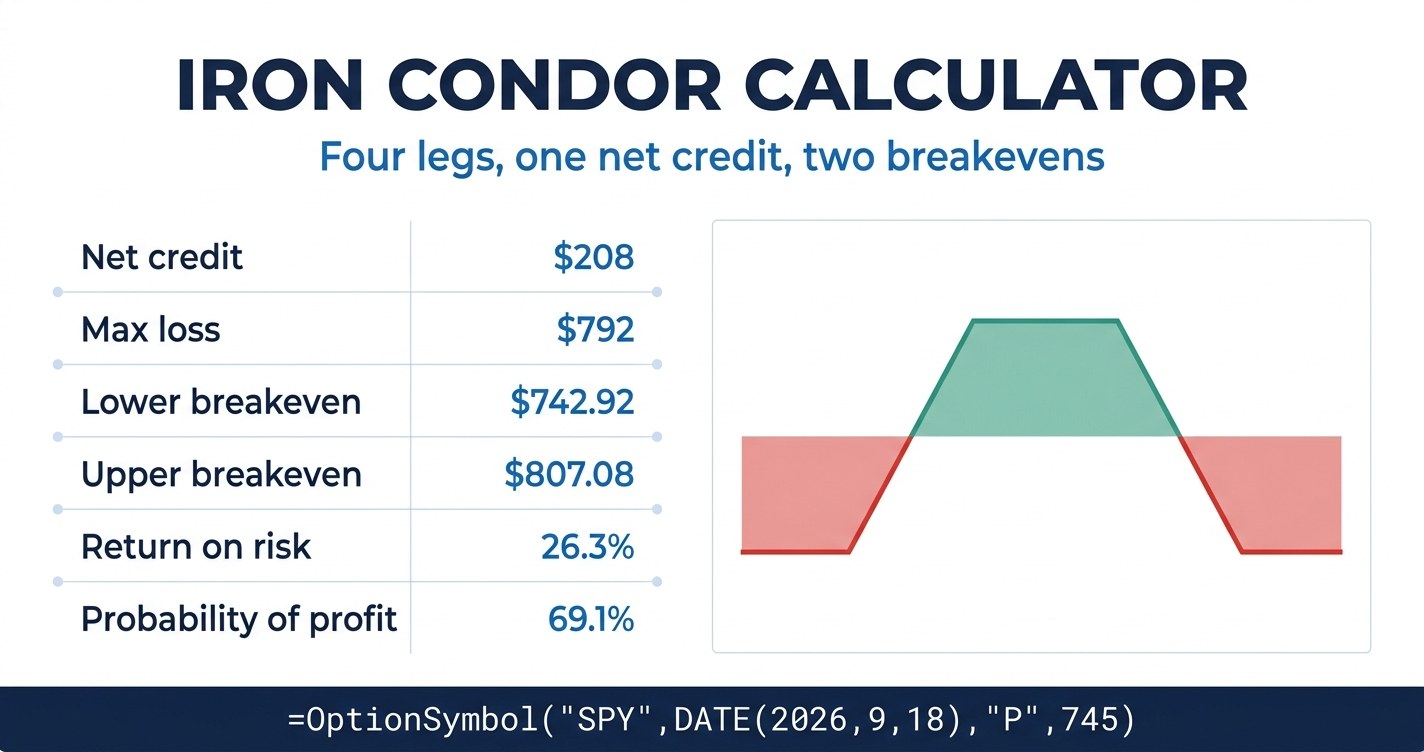
Iron condor calculator work is net work. Four contracts trade at once, two bought and two sold, and not one of the four legs means anything on its own. The credit is a net credit, the risk is a net risk, and the position carries two breakevens instead of one because it loses money in both directions. A tool that prices one vertical spread and leaves you to add the other half by hand has done less than half the job. This guide builds one that takes all four legs together, then reports the credit, both breakevens, the worst case, the return on risk and the odds on one screen.
Every figure below comes from one live SPY option chain, priced on 2026-08-15 with the underlying at $776.34 and 34 days left to the 2026-09-18 expiry.
Iron condor calculator: four strike configurations on one board
The fastest way to understand what a calculator is for is to price the same idea four different ways. All four condors below sell a put spread below the market and a call spread above it, on the same underlying and the same expiry. They differ only in where the strikes sit. Sellers receive the bid and buyers pay the ask, because that is what a taker actually gets filled at.
| Measure | Tight | Standard | Wide | Narrow wings |
|---|---|---|---|---|
| Long put / short put | 745 / 755 | 735 / 745 | 725 / 735 | 740 / 745 |
| Short call / long call | 795 / 805 | 805 / 815 | 815 / 825 | 805 / 810 |
| Net credit per share | $3.65 | $2.08 | $1.15 | $1.18 |
| Maximum profit | $365 | $208 | $115 | $118 |
| Maximum loss | $635 | $792 | $885 | $382 |
| Lower breakeven | $751.35 | $742.92 | $733.85 | $743.82 |
| Upper breakeven | $798.65 | $807.08 | $816.15 | $806.18 |
| Breakeven width | $47.30 | $64.16 | $82.30 | $62.36 |
| Return on risk | 57.5% | 26.3% | 13.0% | 30.9% |
| Probability of profit | 54.7% | 69.1% | 80.8% | 67.8% |
| Chance of full max profit | 47.5% | 65.9% | 79.5% | 65.9% |
| Chance of touching a short strike | 49.1% / 55.7% | 30.8% / 37.0% | 17.6% / 22.9% | 30.8% / 37.0% |
| Theta per day | $5.82 | $5.39 | $4.05 | $2.86 |
| Vega per volatility point | -$33.52 | -$32.39 | -$24.82 | -$16.95 |
Read the return on risk row against the probability row and the pattern is immediate. The tight condor returns 57.5% on risk and wins barely more than half the time. The wide condor wins four times in five and returns 13%. Those two columns move in opposite directions by construction, and no strike selection escapes that trade.
The fourth column is the one worth staring at. The narrow wing condor keeps the same short strikes as the standard one, so its breakevens land within a dollar of the standard version and its probability of profit is nearly identical. It simply buys the long options five points closer. That halves the maximum loss from $792 to $382 while returning a higher 30.9% on risk. On this particular board the far wings were so cheap that paying up for closer protection cost almost nothing in credit. That is not a general rule about iron condors. It is what this chain priced on this day, and it is exactly the kind of thing you only notice when a spreadsheet puts the four versions next to each other.
What an iron condor calculator actually has to compute
Six numbers describe a condor completely. Most free tools produce two of them and leave the rest implied.
- Net credit. The sum across all four legs: what the two short options bring in, less what the two long options cost. This single number sets the maximum profit, both breakevens and the maximum loss at once, which is why it belongs at the top of any calculator.
- Wing widths. The distance from each short strike to the long strike behind it. These do not have to match, and when they do not, risk is set by the wider one.
- Maximum loss. The widest wing minus the credit. Only one side can finish in the money, so you never lose on both wings at once.
- Both breakevens. The short put strike minus the credit, and the short call strike plus the credit. Two numbers, not one, and the gap between them is the position's entire margin for error.
- Return on risk. Maximum profit divided by maximum loss. This is the honest denominator, because a defined risk condor ties up its maximum loss as margin at most brokers.
- The odds. Not one probability but several, and they disagree with each other in ways that matter.
Work the standard column above through those definitions. The credit is $3.79 collected on the short put, less $2.85 paid for the long put, plus $2.09 collected on the short call, less $0.95 paid for the long call. That nets to $2.08 per share, or $208 for one contract. Both wings are 10 points wide, so the maximum loss is $10.00 minus $2.08, which is $7.92 per share or $792. The breakevens sit at $745.00 minus $2.08 and $805.00 plus $2.08, giving $742.92 and $807.08. Return on risk is $208 divided by $792, which is 26.3%.
Notice that the credit is 20.8% of the wing width. That ratio is a fast sanity check on any condor. If a four leg position pays less than about a fifth of its wing width, the strikes are usually too far out to be worth the margin they consume.
The payoff table, and why the middle is flat
An iron condor calculator earns its keep at the moment the payoff stops being a formula and becomes a table. Here is the standard condor across a ladder of closing prices.
| SPY at expiry | Move from spot | Net profit and loss |
|---|---|---|
| $720.00 | -7.3% | -$792 |
| $730.00 | -6.0% | -$792 |
| $735.00 | -5.3% | -$792 |
| $740.00 | -4.7% | -$292 |
| $742.92 | -4.3% | $0 |
| $745.00 | -4.0% | +$208 |
| $760.00 | -2.1% | +$208 |
| $776.34 | 0.0% | +$208 |
| $790.00 | +1.8% | +$208 |
| $805.00 | +3.7% | +$208 |
| $807.08 | +4.0% | $0 |
| $810.00 | +4.3% | -$292 |
| $815.00 | +5.0% | -$792 |
| $840.00 | +8.2% | -$792 |
The middle of that table is perfectly flat. Every close between $745 and $805 pays exactly $208, whether the underlying finishes one dollar above the short put or one dollar below the short call. An iron condor does not reward being right about direction. It rewards the underlying failing to travel, which is a different claim entirely, and a much narrower one than most range trades admit.
The two edges are equally instructive. Between $735 and $745 the loss scales in a straight line, because the short put is in the money and the long put has not caught up yet. Below $735 the loss stops dead at $792 no matter how far the market falls. That flat floor is the whole reason to buy the wings at all. A short strangle with the same short strikes would collect more credit and keep losing all the way down.
Choosing the wings, which is the only real decision
Once the underlying and the expiry are fixed, an iron condor is entirely a strike selection problem. The comparison board at the top of this article is the calculator's most useful sheet, and there are three ways to read it.
Moving both short strikes. Compare the tight, standard and wide columns. Pulling the short strikes in from roughly 4% away to roughly 2.7% away nearly doubles the credit, from $2.08 to $3.65. It also drags the probability of full profit down from 65.9% to 47.5%, and it pulls the breakevens in from a $64.16 window to a $47.30 window. The credit rises because you are selling options much closer to the money, and options closer to the money are worth more precisely because they are more likely to matter.
Moving only the long strikes. Compare the standard and narrow wing columns. The short strikes are identical, so the credit only falls from $2.08 to $1.18, and the breakevens barely move. But the maximum loss falls from $792 to $382. You gave up 43% of the credit to remove 52% of the risk. Whether that is a good trade depends entirely on what the far wings cost on the day, which is why it needs to be priced rather than assumed.
Reading the skew. The quote board reveals something the strike numbers hide. The 735 put carries a 16.6% implied volatility while the 815 call carries 11.0%, even though both sit roughly 5% from the money. Puts are systematically more expensive than equidistant calls on index products, and that gap has a direct consequence for strike selection. To collect comparable credit from both sides you have to sell the put further out than the call, which is exactly what the standard condor does: its short put sits 4.04% below spot while its short call sits only 3.69% above. The put spread still pays less, $0.94 against $1.14 for the call spread, because the call side is closer to the money. The result is a position whose two sides are not mirror images, and a net delta of -0.034 that leans slightly short. That tilt is a by-product of the skew rather than an expression of any view.
The odds most iron condor calculators do not show
Here is the table that separates a real calculator from a payoff diagram with a probability bolted on.
| Level | Price | Chance of finishing past it | Chance of touching it |
|---|---|---|---|
| Long put | $735.00 | 8.1% | 17.6% |
| Short put | $745.00 | 14.3% | 30.8% |
| Lower breakeven | $742.92 | 12.8% | 27.7% |
| Upper breakeven | $807.08 | 18.1% | 33.7% |
| Short call | $805.00 | 19.8% | 37.0% |
| Long call | $815.00 | 12.4% | 22.9% |
The right hand column runs at roughly double the middle one, and that gap is the single most under reported fact about selling condors. The standard condor keeps its full credit 65.9% of the time and finishes profitable 69.1% of the time. Both are comfortable numbers. But the underlying trades through one of the short strikes at some point before expiry far more often than either figure suggests, because touching a level only requires reaching it once on any day, while finishing past it requires sitting there on the final one.
The practical consequence is about planning rather than probability. If your intention is to adjust or close when a wing gets tested, then the touch column is your actual trade frequency, not the finish column. A position you expect to manage two times in three is a very different commitment from one you expect to manage one time in three, even when both share the same headline probability of profit.
Position greeks, and the trade hiding inside the trade
| Leg | Strike | Delta | Theta per day | Vega per point |
|---|---|---|---|---|
| Long put | 735 | -0.1230 | -$10.97 | +$48.20 |
| Short put | 745 | +0.1673 | +$12.27 | -$59.32 |
| Short call | 805 | -0.1680 | +$10.83 | -$59.47 |
| Long call | 815 | +0.0892 | -$6.74 | +$38.21 |
| Net position | -0.0344 | +$5.39 | -$32.39 |
Four readings come out of that bottom row.
Delta is near zero but not zero. The net figure is equivalent to being short about 3.4 shares. A symmetric condor tilts slightly short because of the volatility skew described above, not because of any directional view built into the structure.
Gamma is negative. At -0.0050 it is small today, but negative gamma means delta moves against you in both directions, and it does so faster as expiry approaches. A condor that looks comfortably neutral three weeks out can develop real directional exposure in its final days without the underlying doing anything dramatic.
Theta is the only greek working for you. At $5.39 per day, decay is the entire economic engine of the position. Everything else on the list is a cost of admission.
Vega is the risk nobody plans for. At -$32.39 per volatility point, this position loses about six days of collected theta for every single point implied volatility rises. A three point volatility expansion costs roughly $97, which is 47% of the maximum profit, and it can happen without the underlying moving at all. An iron condor is a short volatility trade wearing a range trade costume, and the vega to theta ratio is the number that says so out loud.
What the calculator cannot tell you
Every probability on this page comes from the option market's own implied volatility, run through a lognormal model. That is a pricing convention, not a forecast, and it is worth being blunt about what it does and does not deliver.
Here is the standard condor's expected profit and loss under a range of assumptions about what volatility actually turns out to be, holding the entry prices fixed.
| If realized volatility is | Expected profit and loss | Probability of profit |
|---|---|---|
| 8% | +$135 | 90.3% |
| 10% | +$61 | 82.0% |
| 11% | +$22 | 77.8% |
| 12.25% | -$25 | 72.8% |
| 13.25% | -$61 | 69.1% |
| 15% | -$119 | 63.2% |
| 18% | -$205 | 54.8% |
| 22% | -$294 | 46.2% |
The expected value crosses zero at about 11.6% realized volatility. Above that the position loses money on average, and below it the position makes money on average. Nothing about the strike selection changes that structure. The entire economics of a short condor reduce to one question that no calculator can answer: will the underlying move less than the options are priced for.
This is why a high probability of profit is not the same as an edge. The wide condor wins 80.8% of the time and still carries a negative expected value at a 13.25% volatility assumption, because the 19.2% of outcomes where it loses cost $885 each. A calculator's job is to make that arithmetic visible, not to make a position look good.
Two smaller costs belong in the same honest column. Crossing the bid and ask on all four legs costs about $9.00 per contract at these quotes, which is 4.3% of the maximum profit before commissions. And a condor held through an earnings report or a scheduled macro release is exposed to exactly the volatility expansion its vega punishes, which is why the workbook includes an =earnings_date("AAPL") check.
Building the iron condor calculator with MarketXLS formulas
Every contract level function needs a contract symbol rather than a ticker. Build it once with OptionSymbol and point the rest of the row at that cell instead of nesting the call four times.
=OptionSymbol("SPY",DATE(2026,9,18),"P",745)
That returns the QuoteMedia symbol every other function expects. From there the four legs price themselves:
=QM_Bid(E11)          Price you receive on a leg you sell
=QM_Ask(E10)          Price you pay on a leg you buy
=QM_Last(E11)         Last traded price, useful as a reference but not a fill
=QM_OpenInterest(E11) Liquidity check before you size the position up
The net credit is then one formula across the four leg prices:
=(D11-D10)+(D12-D13)
Maximum loss, both breakevens and return on risk all follow from that single cell:
=(MAX(C11-C10,C13-C12)-B17)*100    Maximum loss per contract
=C11-B17                            Lower breakeven
=C12+B17                            Upper breakeven
=B22/B23                            Return on risk
The greeks take eight arguments, and the argument order traps people. The dividend yield sits between the risk free rate and sigma, so a five argument call is fine and a seven argument call is usually a mistake:
=opt_Delta(spot, optionPrice, expiry, "Put", strike, rate, divYield, sigma)
=opt_Gamma(spot, optionPrice, expiry, "Put", strike)
=opt_Theta(spot, optionPrice, expiry, "Call", strike)
=opt_Vega(spot, optionPrice, expiry, "Call", strike)
=opt_ImpliedVolatility(spot, optionPrice, expiry, "Put", strike)
Volatility context comes from a separate group, and it answers the only question that decides whether the credit is rich or thin:
=ImpliedVolatility30d("SPY")        30 day implied volatility, as a decimal
=ImpliedVolatilityRank1y("SPY")     Where that sits in its own one year range
=StockVolatilityThirtyDays("SPY")   Realized volatility, to compare against implied
That last pairing is the one to build a habit around. Implied volatility rank tells you whether you are being paid more or less than usual for the same risk, and the realized comparison tells you whether recent history justifies the price.
The probability cells use standard Excel functions so they recalculate without any add-in dependency. The chance of finishing between the breakevens is a difference of two lognormal cumulative distribution calls:
=NORMSDIST((LN(B25/E4)-((B6-E6-0.5*G6^2)*(E5/365)))/(G6*SQRT(E5/365)))
 -NORMSDIST((LN(B24/E4)-((B6-E6-0.5*G6^2)*(E5/365)))/(G6*SQRT(E5/365)))
And the touch probability, the one the workbook adds and most calculators skip, is a single reflection principle formula:
=MIN(1,2*NORMSDIST(-ABS(LN(C11/E4))/(G6*SQRT(E5/365))))
Managing the position after it is on
The calculator's scenario sheet prices the exit as carefully as the entry, because for a short condor the exit is where most of the decisions live.
| Close at | Buy the condor back for | Profit kept | Risk still on the table |
|---|---|---|---|
| 25% of max profit | $1.56 | $52 | $792 |
| 50% of max profit | $1.04 | $104 | $792 |
| 75% of max profit | $0.52 | $156 | $792 |
| 100% of max profit | $0.00 | $208 | $0 |
The bottom two rows make the argument for managing early better than any rule of thumb does. Moving from 75% of maximum profit to 100% collects a further $52. To earn it you keep the full $792 of risk live through the highest gamma stretch of the trade, when negative gamma is at its most punishing and a single fast move can turn the whole position around. The reward per unit of remaining risk is at its worst in exactly the final stretch that feels safest.
Frequently asked questions
What is the maximum loss on an iron condor? The widest wing minus the net credit, multiplied by 100 per contract. For the standard condor above that is $10.00 minus $2.08, or $792. Because only one side can finish in the money, you never lose on both wings simultaneously, which is why the wider wing rather than the sum of both wings sets the risk.
Why does an iron condor have two breakevens? Because it loses money in two directions. The lower breakeven is the short put strike minus the credit, and the upper is the short call strike plus the credit. The credit extends the profitable range past both short strikes, which is why the probability of profit is always higher than the probability of collecting the full credit.
Is a higher probability of profit always better? No, and the comparison board shows why. Moving to wider strikes raises the probability of profit from 54.7% to 80.8%, but it also cuts the return on risk from 57.5% to 13.0%. The two move in opposite directions, and the expected value table shows that a high win rate does not create an edge on its own.
How wide should the wings be? Price it rather than assume it. On the board above, narrowing the wings from 10 points to 5 points cut the maximum loss by 52% while giving up only 43% of the credit, which improved the return on risk. That happened because the far wings were unusually cheap that day. On a chain with a steeper skew the same change can be a poor trade, so the comparison belongs in a spreadsheet.
Why is my symmetric iron condor not delta neutral? Volatility skew. Puts carry higher implied volatility than calls at the same distance from the money, so a condor with matching strike distances collects more credit on the put side and carries a small negative delta. The workbook shows -0.034 for the standard configuration, which is equivalent to being short about 3.4 shares.
What hurts an iron condor most? A rise in implied volatility, usually before price does any damage. The standard condor loses about $32.39 for every one point rise in implied volatility, which is roughly six days of collected theta. That is why the vega to theta ratio deserves more attention than it usually gets, and why holding a condor across a scheduled volatility event is a distinct decision from putting it on.
The bottom line
An iron condor calculator is worth building because the position resists mental arithmetic. Four legs, two spreads, two breakevens, two wing widths and at least three different probabilities that all disagree with each other. Getting any one of them wrong changes the trade you think you are in.
The workbook here prices all four legs from one chain, reports the net numbers that actually describe the position, and adds the two columns most tools omit: the chance of a wing being touched rather than merely breached at expiry, and the expected value across a range of realized volatility assumptions. Neither column makes a condor look better. Both make it look accurate, which is the only thing a calculator owes you.
Download the two workbooks and point them at your own chain:
- Iron Condor Calculator Sample with the SPY quotes from 2026-08-15 filled in, so you can see every calculation resolved
- Iron Condor Calculator Template with live MarketXLS formulas that reprice when you change the ticker
Both include seven sheets: a walkthrough, the calculator, a payoff ladder, the wing selector, a scenario sheet, position greeks and a full formula reference.
To build this on your own watchlist, see the MarketXLS options functions and the function documentation. If you would like a walkthrough of how the option chain functions fit into an existing workflow, book a demo or start at marketxls.com.
This article is educational. It is not investment advice, and it does not recommend any position, strategy or security. Options carry risk, including the total loss of the amount at risk. All prices are from a single option chain on 2026-08-15 and will not match current quotes.