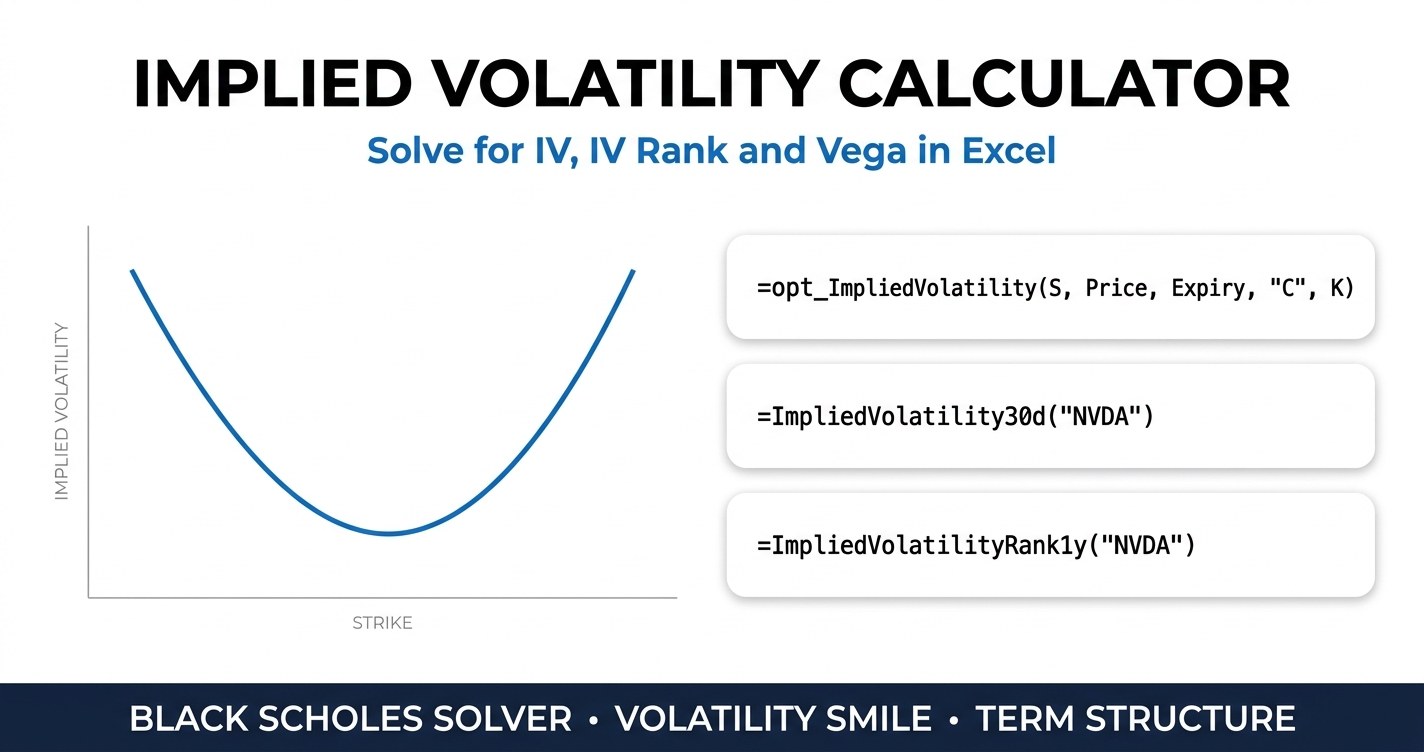
Implied volatility calculator output is the one options figure that is never measured. It is solved. No formula returns implied volatility, because Black-Scholes takes volatility as an input and hands back a price. Every tool that displays an IV number ran that formula backwards, guessing volatility until its model price matched the market price. Where the search lands depends on the interest rate, the dividend, the time convention and the market price it started from, and most calculators show you none of the four. This guide builds that search in Excel, one auditable row at a time, then shows what the solved number is worth to a position.
Every figure below comes from one worked contract, priced on 2026-08-15.
Implied volatility calculator: the contract at a glance
| Input | Value |
|---|---|
| Underlying | NVDA at $225.16 |
| Strike | $230.00 call |
| Expiry | 2026-09-18 (34 days) |
| Bid / Ask | $8.50 / $8.60 |
| Mid price | $8.55 |
| Open interest | 32,628 contracts |
| Risk free rate (13 week bill) | 3.697% |
| Dividend yield | 0.44% |
| Solved implied volatility | 37.96% |
| Vega, per 1 volatility point | $0.2727 per share |
| 30 day realised volatility | 39.34% |
| Next earnings date | 2026-08-26 |
That 37.96% is the whole exercise. The rest of this guide is about where it comes from, how much it moves when you change an input, and what it means once you have it.
Why there is no implied volatility formula
Black-Scholes is a one way machine. Feed it a spot price, a strike, a time to expiry, a rate, a dividend yield and a volatility, and it returns a price. Five of those six inputs are observable. You can read the spot off a quote screen, the strike and expiry off the contract, the rate off the bill curve and the dividend yield off the company. Volatility is the one input nobody can observe, because it describes the future.
Implied volatility flips the machine around. You hold the option's market price fixed, treat volatility as the unknown, and ask which volatility would have produced that price. The problem is that Black-Scholes cannot be rearranged to isolate volatility. The unknown appears inside a cumulative normal distribution and also multiplied by a square root of time, and there is no algebra that untangles it.
So every implied volatility calculator does the same thing: it guesses, prices the option at that guess, compares the result to the market price, and adjusts. The guessing is the calculation. That is why two platforms can disagree about the IV of the same contract while both being correct about their own arithmetic. They started from different inputs, or they stopped searching at a different tolerance.
This matters more than it sounds. If you are comparing IV across brokers, across strikes, or against a historical series, you need to know that all the numbers were produced the same way. Building the solver yourself is the cheapest way to know that.
Building the implied volatility calculator in Excel
The search method worth using is Newton-Raphson, because option pricing hands you the derivative for free. Vega is the rate of change of the option price with respect to volatility. That is exactly the slope Newton's method needs, so you never have to approximate it.
The loop is three lines of reasoning:
- Price the option at the current volatility guess.
- Measure the error against the market price.
- Divide the error by vega to get the volatility correction, and subtract it.
Repeat until the error stops mattering. Here is that loop running on the worked contract, starting from a deliberately bad guess of 30%.
| Iteration | Volatility guess | Black-Scholes price | Market price | Pricing error | Vega | Next guess |
|---|---|---|---|---|---|---|
| 1 | 30.0000% | $6.3870 | $8.55 | -2.162985 | 27.0838 | 37.9863% |
| 2 | 37.9863% | $8.5584 | $8.55 | +0.008381 | 27.2693 | 37.9555% |
| 3 | 37.9555% | $8.5500 | $8.55 | +0.000000 | 27.2689 | 37.9555% |
Three iterations. The first step covers almost eight volatility points, the second closes the gap to under a hundredth of a cent, and the third confirms it. Newton's method roughly doubles the number of correct digits each pass when it is behaving, which is why nothing in this table looks like a slow grind.
The Excel formulas behind the table use only legacy function names, which matters because the modern equivalents get written with an _xlfn prefix by some tools and then break as #NAME? on other machines.
d1     =(LN($B$6/$B$7)+($B$11-$B$12+0.5*B18^2)*$E$15)/(B18*SQRT($E$15))
d2     =d1-B18*SQRT($E$15)
Call   =$B$6*EXP(-$B$12*$E$15)*NORMSDIST(d1)-$B$7*EXP(-$B$11*$E$15)*NORMSDIST(d2)
Vega   =$B$6*EXP(-$B$12*$E$15)*NORMDIST(d1,0,1,FALSE)*SQRT($E$15)
Next   =MAX(0.000001,B18-MEDIAN(-0.5,E18/F18,0.5))
Two details in that last line are worth stealing. The MEDIAN(-0.5, step, 0.5) clamp stops a single oversized correction from throwing the guess into negative territory, which is what happens on deep out of the money contracts where vega is tiny and the error divided by vega explodes. The MAX(0.000001, ...) floor keeps volatility positive so the logarithm in the next pass stays defined. Most published Excel IV solvers omit both, work fine on at the money examples, and fall over on the wings.
The one cell version
Once you trust the ladder, you rarely want to look at it again. MarketXLS collapses the whole search into a single call:
=opt_ImpliedVolatility($B$6,$B$10,TEXT($B$8,"yyyy-mm-dd"),$B$9,$B$7,$B$11,$B$12)
The arguments are spot, market option price, expiry, option type, strike, risk free rate and dividend yield. The workbook puts this cell directly beside the final row of the ladder so you can confirm the two agree before you rely on either. Keeping both is not redundancy. The ladder is what you show somebody who asks how the number was produced, and the single cell is what you copy down a thousand rows.
The inputs nobody shows you, and how much they matter
Here is the part that explains why your broker's IV and your spreadsheet's IV disagree. The same contract, solved six ways:
| Input choice | Option price used | Solved IV | Difference vs mid |
|---|---|---|---|
| Bid price | $8.50 | 37.77% | -0.18 points |
| Mid price (base case) | $8.55 | 37.96% | base |
| Ask price | $8.60 | 38.14% | +0.18 points |
| Last traded price | $8.54 | 37.92% | -0.04 points |
| Mid, rate set to zero | $8.55 | 39.14% | +1.19 points |
| Mid, dividend set to zero | $8.55 | 37.80% | -0.16 points |
Three things stand out.
The bid to ask spread on this contract is ten cents, and it maps to a band of about 0.37 volatility points. That band is the honest uncertainty in the answer. Quoting IV to two decimal places when the spread covers a third of a point is false precision, and it is the reason a screener that ranks contracts by IV differences of a tenth of a point is mostly ranking noise.
Using the last traded price instead of the mid moves the answer by only four hundredths of a point here, but only because this contract traded 8,684 times today. On a contract that last printed three hours ago, the last price can be stale by a dollar, and the IV derived from it is meaningless. Always prefer the mid on anything less than heavily traded.
The rate input is the one that surprises people. Dropping the risk free rate to zero, which plenty of quick calculators quietly do, pushes the solved volatility up by 1.19 points. That is more than three times the width of the bid to ask band. If you are comparing your IV against a broker's and you are a point or so apart, the rate convention is the first place to look, not the pricing model.
The dividend yield matters far less here, at 0.16 points, but only because NVDA pays almost nothing. Run the same test on a high yielding name or an index proxy and the dividend term becomes as significant as the rate.
One volatility number does not price the chain
Solve the same expiry at every strike and the flat number falls apart. Black-Scholes assumes a single volatility governs the underlying. The market disagrees, visibly and consistently.
| Strike | Moneyness | Mid | Call IV | Call delta | Vega per point |
|---|---|---|---|---|---|
| $195 | 0.866 | $32.20 | 40.32% | 0.895 | 0.125 |
| $200 | 0.888 | $27.98 | 40.31% | 0.853 | 0.158 |
| $205 | 0.910 | $23.85 | 39.45% | 0.806 | 0.189 |
| $210 | 0.933 | $20.07 | 39.05% | 0.748 | 0.219 |
| $215 | 0.955 | $16.62 | 38.67% | 0.683 | 0.245 |
| $220 | 0.977 | $13.57 | 38.49% | 0.611 | 0.263 |
| $225 | 0.999 | $10.88 | 38.22% | 0.536 | 0.273 |
| $230 | 1.021 | $8.55 | 37.96% | 0.460 | 0.273 |
| $235 | 1.044 | $6.62 | 37.82% | 0.387 | 0.263 |
| $240 | 1.066 | $5.05 | 37.72% | 0.319 | 0.245 |
| $245 | 1.088 | $3.80 | 37.69% | 0.258 | 0.222 |
| $250 | 1.110 | $2.84 | 37.83% | 0.205 | 0.195 |
| $255 | 1.133 | $2.12 | 38.06% | 0.162 | 0.168 |
The curve runs from 40.32% at the $195 strike down to 37.69% at $245, then turns back up to 38.06% at $255. That is 2.10 points of extra volatility priced into the downside strikes relative to at the money, and a small upward tick at the far upside. The shape is the equity skew, and it is not a pricing error. It reflects the fact that equities fall faster than they rise and that demand for downside protection is structurally heavier than demand for upside exposure.
The practical consequence is direct. Any spread that buys one strike and sells another is trading the slope of this curve as well as its level. A vertical spread built across strikes carrying a two point volatility difference is not a pure directional bet, and the calculator that gave you one at the money IV number told you nothing about that.
The $225 line is also a free integrity check. The call there solves to 38.22% and the put at the same strike solves to 38.28%. Put-call parity says those should be nearly identical, and six hundredths of a point apart is exactly what a healthy two sided market looks like. A wide gap at a shared strike almost always means one of the two quotes is stale, not that you found an arbitrage.
The term structure dates the catalyst
Now hold the strike at the money and walk out through the expirations.
| Expiration | Days | Mid | ATM IV | Change vs prior |
|---|---|---|---|---|
| 2026-08-17 | 2 | $1.79 | 25.32% | |
| 2026-08-19 | 4 | $2.96 | 30.26% | +4.94 |
| 2026-08-21 | 6 | $3.85 | 32.22% | +1.96 |
| 2026-08-28 | 13 | $7.75 | 44.53% | +12.31 |
| 2026-09-04 | 20 | $9.00 | 41.53% | -3.00 |
| 2026-09-11 | 27 | $9.80 | 38.75% | -2.78 |
| 2026-09-18 | 34 | $10.88 | 38.22% | -0.53 |
| 2026-09-25 | 41 | $11.90 | 38.00% | -0.22 |
| 2026-10-16 | 62 | $14.70 | 37.97% | -0.03 |
| 2026-11-20 | 97 | $19.50 | 40.11% | +2.14 |
| 2026-12-18 | 125 | $21.95 | 39.56% | -0.55 |
| 2027-01-15 | 153 | $24.73 | 40.17% | +0.61 |
The step between 21 August and 28 August is a twelve point jump in implied volatility for one extra week of calendar time. Nothing about the company changed to cause it. That week contains the earnings release on 26 August, and the option market cannot price a window holding an unknown result the way it prices a quiet week.
You do not need to be told the earnings date to find it here. The term structure gives it away. Whichever expiration first shows an outsized jump is the one that swallowed the event, and that is a genuinely useful thing for a calculator to surface, because it tells you which contracts carry event premium and which do not. Everything from 4 September onward is decaying back toward the low thirty eights as the event moves further into the past relative to the remaining time.
The straddle prices make the same point in dollars.
| Expiration | Days | ATM straddle | Expected move |
|---|---|---|---|
| 2026-08-21 | 6 | $7.30 | 3.24% |
| 2026-08-28 | 13 | $15.00 | 6.66% |
| 2026-09-18 | 34 | $20.93 | 9.29% |
Adding seven days across the earnings date doubles the straddle. That is the market's price on the event itself, and it is the number to compare against your own view of how far the stock might travel. If you want the strategy side of that trade, the long straddle and high implied volatility write ups cover the construction and the risks, and the calendar spread page covers the trade that targets the kink between two expirations directly.
Is 37.96% high or low?
A raw IV number means nothing without a reference. The most useful one is the volatility the stock actually delivered.
| Symbol | Price | ATM IV | 30 day HV | IV / HV | HV percentile 1y |
|---|---|---|---|---|---|
| AMD | $514.39 | 57.44% | 78.83% | 0.73 | 67.1% |
| TSLA | $342.27 | 38.96% | 60.44% | 0.64 | 93.0% |
| NVDA | $225.16 | 38.75% | 39.34% | 0.99 | 66.7% |
| META | $589.85 | 32.54% | 47.48% | 0.69 | 84.4% |
| MSFT | $495.40 | 24.46% | 49.16% | 0.50 | 96.3% |
| AAPL | $305.93 | 22.98% | 32.02% | 0.72 | 87.2% |
| JPM | $362.84 | 18.46% | 19.85% | 0.93 | 23.9% |
| SPY | $776.34 | 12.06% | 12.47% | 0.97 | 46.9% |
Read the IV column alone and AMD looks wildly expensive against SPY. That comparison is meaningless, because a 57% volatility can be perfectly ordinary for one asset and a crisis reading for another. The IV divided by HV column puts every name on one scale, and the picture inverts: AMD's implied volatility sits at 0.73 of what the stock has recently delivered, while NVDA and SPY are close to parity.
Two cautions before you read anything into a low ratio. Realised volatility looks backward and implied volatility looks forward, so they are not measuring the same thing and there is no reason for the ratio to sit at 1.00. And a large recent move inflates the denominator for a full month afterward. That is what the HV percentile column is for. MSFT's ratio of 0.50 looks dramatic until you notice its realised volatility is at the 96th percentile of the last year, meaning the denominator is the unusual number, not the numerator.
For the forward looking version of the same question, MarketXLS carries IV rank and IV percentile directly, which compare current implied volatility against its own history rather than against realised:
=ImpliedVolatility30d("NVDA")      Thirty day implied volatility, as a decimal
=ImpliedVolatilityRank1y("NVDA")   Where current IV sits in its 1 year range
=ImpliedVolatilityPct1y("NVDA")    Share of the last year spent below current IV
=StockVolatilityThirtyDays("NVDA") Thirty day realised volatility
=StockVolatilityOneYear("NVDA")    One year realised volatility
These need a stored history of implied volatility, which is why they are add-in functions rather than something a spreadsheet can derive from a single chain snapshot. If you want to run this comparison across hundreds of names rather than eight, the implied volatility screener guide covers the filtering side of the same data.
What the number is worth in dollars
Solving for IV is only half the job. The other half is knowing what a change in it does to a position. That is vega, and on this contract it is $0.2727 per share for a one point move, which is $27.27 per contract and $136.34 across five contracts.
Here is five contracts of the $230 call, holding the stock and the clock still, moving only implied volatility.
| IV change | Implied vol | Position value | Profit or loss | Return |
|---|---|---|---|---|
| -10 points | 27.96% | $2,917 | -$1,358 | -31.8% |
| -5 points | 32.96% | $3,594 | -$681 | -15.9% |
| -3 points | 34.96% | $3,866 | -$409 | -9.6% |
| -1 point | 36.96% | $4,139 | -$136 | -3.2% |
| 0 | 37.96% | $4,275 | $0 | 0.0% |
| +1 point | 38.96% | $4,411 | +$136 | +3.2% |
| +3 points | 40.96% | $4,684 | +$409 | +9.6% |
| +5 points | 42.96% | $4,958 | +$683 | +16.0% |
| +10 points | 47.96% | $5,641 | +$1,366 | +32.0% |
A ten point volatility move is worth roughly a third of the position, in either direction, with the stock completely unchanged. Given that the term structure above shows a twelve point step around a single earnings date, a ten point collapse the morning after that event is not a tail scenario. It is the ordinary outcome.
Now let price and volatility move together. Each cell is the profit or loss on five contracts.
| Underlying move | -10 pts | -5 pts | -2 pts | 0 | +2 pts | +5 pts | +10 pts |
|---|---|---|---|---|---|---|---|
| -10% ($202.64) | -$3,973 | -$3,703 | -$3,506 | -$3,362 | -$3,210 | -$2,966 | -$2,526 |
| -5% ($213.90) | -$3,170 | -$2,662 | -$2,337 | -$2,115 | -$1,888 | -$1,541 | -$948 |
| -2% ($220.66) | -$2,228 | -$1,601 | -$1,217 | -$959 | -$700 | -$308 | +$349 |
| 0% ($225.16) | -$1,358 | -$681 | -$273 | $0 | +$273 | +$683 | +$1,366 |
| +2% ($229.66) | -$282 | +$416 | +$834 | +$1,113 | +$1,392 | +$1,810 | +$2,506 |
| +5% ($236.42) | +$1,714 | +$2,385 | +$2,791 | +$3,064 | +$3,338 | +$3,750 | +$4,440 |
| +10% ($247.68) | +$5,921 | +$6,434 | +$6,766 | +$6,995 | +$7,230 | +$7,591 | +$8,210 |
Look at the two bolded corners. A long call, with the stock up 2%, loses $282 if implied volatility drops ten points. The same long call, with the stock down 2%, makes $349 if implied volatility rises ten points. Direction was right in the first case and wrong in the second, and the profit and loss went the other way both times.
That is the single most expensive lesson in options, and no calculator that returns a bare IV number will teach it to you. It is also why the workbook sizes positions against two budgets rather than one. Premium paid is the maximum loss on a long option, so a 2% risk limit on a $100,000 account allows two contracts at $855 of premium each. A separate 0.5% vega limit allows eighteen. The smaller number wins, and which one is smaller changes completely when you move from a 34 day contract to a long dated one carrying several times the vega per dollar of premium.
One caution on the grid: it holds time constant. Theta on this contract runs at $0.1606 per share per day, which is another $80.29 per day across five contracts, draining underneath everything shown above.
What is in the workbook
Both files carry the same eight sheets. The sample has static values with the MarketXLS formula stored in each cell comment, and the template has live formulas throughout.
| Sheet | What it does |
|---|---|
| Cover | Contract summary, solved IV and the data date |
| How To Use | Sheet guide and the meaning of every yellow input cell |
| IV Calculator | The Newton ladder, the one cell solve, input sensitivity and the Greeks |
| Volatility Smile | Solved IV at every strike, call against put, with delta and vega |
| Term Structure | ATM IV by expiration with the earnings expiration flagged |
| IV vs HV | Peer comparison of implied against realised volatility |
| Vega Scenarios | The two tables above, driven by your own contract count |
| Position Sizing | Contract count from a premium budget and a vega budget |
The yellow cells on the IV Calculator sheet drive everything downstream. Change the ticker, the strike, the expiry or the option type and the whole workbook follows. The OptionSymbol function builds the contract symbol that every option level formula needs, which saves you from hand typing the QuoteMedia format and its two spaces after the ticker:
=OptionSymbol($B$5,TEXT($B$8,"yyyy-mm-dd"),$B$9,$B$7)
=opt_Delta($B$6,$B$10,TEXT($B$8,"yyyy-mm-dd"),$B$9,$B$7,$B$11,$B$12)
=opt_Vega($B$6,$B$10,TEXT($B$8,"yyyy-mm-dd"),$B$9,$B$7,$B$11,$B$12)
=QM_OpenInterest(OptionSymbol($B$5,TEXT($B$8,"yyyy-mm-dd"),$B$9,$B$7))
=earnings_date($B$5)
Download the templates:
- Static Version (with MarketXLS formula reference) - Pre-filled with the data above, formula in every cell comment
- MarketXLS Formula Version - Live formulas, point it at any ticker
If you want the payoff and breakeven side of a single contract rather than the volatility side, the call option profit calculator workbook covers that ground.
Frequently asked questions
How does an implied volatility calculator actually work?
It searches. Black-Scholes cannot be rearranged to isolate volatility, so the calculator guesses a volatility, prices the option, compares that price to the market price, and adjusts the guess. Newton-Raphson is the usual method because vega gives it the exact slope it needs. On the worked contract above it converged from a 30% starting guess to 37.9555% in three passes.
Why do my broker and my spreadsheet show different implied volatility?
Almost always the inputs, not the maths. The table above shows the same contract solving anywhere from 37.77% to 39.14% depending on whether you use the bid, the mid, the ask or the last price, and on whether the calculator includes a risk free rate at all. Dropping the rate to zero alone moved the answer by 1.19 volatility points. Match the inputs and the answers converge.
Should I use the bid, the mid or the last price?
Use the mid of bid and ask in almost every case. The last traded price can be hours stale on a thinly traded contract, and IV derived from a stale price is not a current reading. Treat the bid IV and the ask IV as the honest uncertainty band around your answer, which on the contract above was about 0.37 of a volatility point.
What is the difference between implied volatility and IV rank?
Implied volatility is a level, and levels are not comparable across names. IV rank puts the current level inside that same underlying's own one year range, so a rank near the top means options are expensive relative to how that stock's options usually price, whatever the absolute number is. ImpliedVolatilityRank1y returns it directly, and ImpliedVolatilityPct1y gives the percentile version.
Why does implied volatility differ across strikes on the same expiry?
Because the single volatility assumption inside Black-Scholes does not match how equities actually move. Downside strikes on the chain above carried 2.10 more volatility points than at the money. The slope is called skew, and it means any spread built across strikes is trading that slope as well as direction.
Can Excel solve implied volatility without an add-in?
Yes. The Newton ladder in this workbook uses only LN, EXP, SQRT, NORMSDIST, NORMDIST, MAX and MEDIAN. What Excel cannot do on its own is fetch the live option quote, the underlying price and the rate that the solver needs as inputs, or supply the year of stored implied volatility history that IV rank requires.
The bottom line
An implied volatility calculator is a search, not a measurement, and treating it as a measurement is how traders end up comparing numbers that were never comparable. Build the search once, in a sheet where you can see every iteration, and three things stop being mysterious: why two platforms disagree, why one IV number cannot price a whole chain, and why a position can be right about direction and still lose money.
The worked contract solved to 37.96%. What made that number useful was not the two decimal places. It was the 0.37 point bid to ask band around it, the 2.10 points of skew across the strikes, the twelve point step in the term structure that dated the earnings release, and the $136.34 of vega per volatility point that turns all of it into dollars.
Nothing here is investment advice or a recommendation on any security. It is a method and a workbook. Point them at whatever you are actually looking at.
Explore the full options function set at MarketXLS, or book a demo to see the volatility functions running against a live chain in your own spreadsheet.