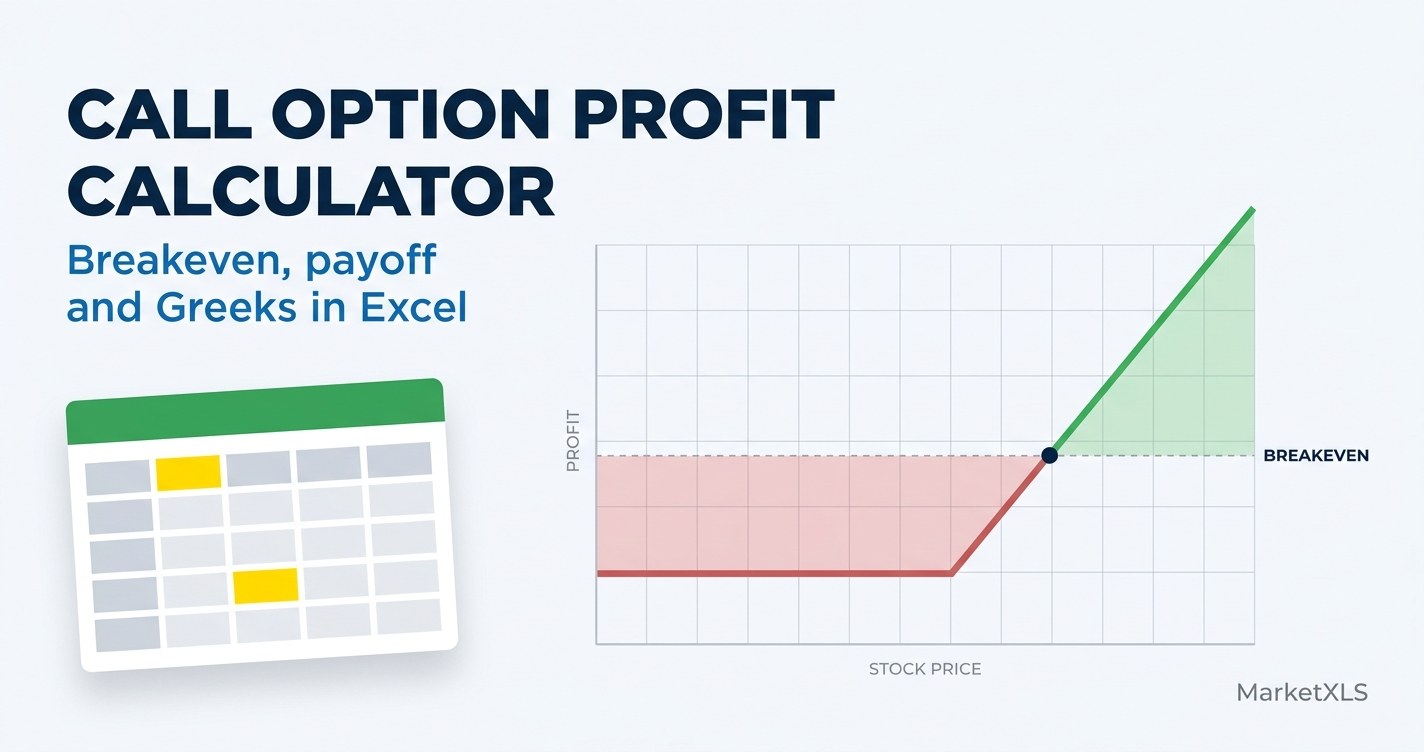
Call option profit calculator results usually reduce to a single line: profit equals the stock price minus the strike minus the premium, at expiration. That line is correct, and it is not enough. A long call has a total cost that includes commission, a breakeven that sits above the strike by every cent you paid, a value on every day before expiration that the expiration formula never shows, and a decay rate that decides whether waiting is affordable at all. This guide builds all five numbers in Excel from a real contract, and ships as a workbook you can point at any ticker.
Every figure below comes from one worked position, priced from the live options chain on 2026-08-15.
Call option profit calculator: the position at a glance
| Input | Value |
|---|---|
| Underlying | AAPL at $305.93 |
| Strike | $310.00 call |
| Expiry | 2026-09-18 (34 days) |
| Premium paid (ask) | $7.20 per share |
| Implied volatility | 23.07% |
| Contracts | 5 (500 shares) |
| Gross premium | $3,600.00 |
| Commission at $0.65 per contract | $3.25 |
| Total cost and maximum loss | $3,603.25 |
| Breakeven at expiry | $317.21 |
| Move required to break even | +3.69% |
| Notional controlled | $152,965 |
| Leverage (notional divided by cost) | 42.45x |
Read the last three rows together. The premium buys exposure to $152,965 of stock for $3,603.25, and in exchange the stock has to rise 3.69% inside 34 days before the position returns a single cent. That trade is the entire subject of this article.
What a call option profit calculator has to compute
A long call is a simple instrument with a deceptively complex value. The buyer pays a premium for the right, but not the obligation, to buy 100 shares at the strike price on or before expiration. The maximum loss is fixed at the premium. The maximum gain has no defined ceiling. Those two sentences are what most people already know, and they are not enough to size or manage a position.
A calculator worth using answers five separate questions.
- Total cost. Premium multiplied by 100, multiplied by the contract count, plus commissions. The workbook keeps commissions visible because they move the breakeven.
- Breakeven. The strike plus every cost per share. Not the strike. Not the current price.
- Payoff at expiration. Profit and loss across a ladder of underlying prices on the final day.
- Value before expiration. What the contract is worth on day 7, day 14 and day 21, which is where almost every position is actually closed.
- Greeks. Delta, gamma, theta, vega and rho, so the holder knows what is moving the position and how fast.
Points four and five are where free web calculators usually go quiet, and they are the two that decide whether a trade is manageable.
Breakeven is the strike plus every cost, not the strike
This is the single most common error in call option maths, so it is worth doing slowly.
The 310 call costs $7.20 per share at the ask. One contract covers 100 shares, so one contract costs $720.00 plus $0.65 commission. Five contracts cost $3,600.00 plus $3.25, or $3,603.25 in total. Spread across 500 shares that is $7.2065 per share, all in.
The call only has intrinsic value above $310.00. To recover $7.2065 per share of cost, the stock has to finish above:
Breakeven = Strike + All-in cost per share
          = 310.00 + 7.2065
          = $317.21
From $305.93 that is a required move of 3.69% in 34 days. At $310.00, exactly at the strike, the position is still down $3,588.25. At $317.21 it is flat. The stock can rise 1.3% and the trade still loses almost the entire premium.
Note also that a buyer pays the ask, not the mid. The bid on this contract was $7.00 and the ask was $7.20. Building a calculator around the mid price of $7.10 quietly moves the breakeven ten cents in your favour, and that is not a price anyone was offered.
The payoff table at expiration
This is the classic hockey stick, in numbers. Each row assumes the contract is held to the last trading day.
| Stock at expiry | Move from today | Profit or loss | Return on premium |
|---|---|---|---|
| $260.04 | -15.00% | -$3,603.25 | -100.0% |
| $275.34 | -10.00% | -$3,603.25 | -100.0% |
| $290.63 | -5.00% | -$3,603.25 | -100.0% |
| $305.93 | 0.00% | -$3,603.25 | -100.0% |
| $310.03 | +1.34% | -$3,588.25 | -99.6% |
| $317.21 | +3.69% | $0 | 0.0% |
| $321.23 | +5.00% | +$2,011.75 | +55.8% |
| $336.52 | +10.00% | +$9,656.75 | +268.0% |
| $351.82 | +15.00% | +$17,306.75 | +480.3% |
| $367.12 | +20.00% | +$24,956.75 | +692.6% |
Two features of this table deserve attention.
The loss is flat and total across the whole left side. Any finish below $310.00 produces the same result, whether the stock drops 5% or 15%. That flat floor is the defining property of a bought call, and it is genuinely useful: the downside is known on the day of entry and it cannot grow.
The right side is where the leverage appears. A 10% rise in the stock produces a 268% return on the premium. The same 10% rise on 500 shares of stock, which would have cost $152,965 to buy, returns about 10%. That asymmetry is why calls attract buyers, and the flat floor on the left is the price of it.
The number that payoff diagrams hide: value before expiration
Almost nobody holds a long call to the final bell. Positions get closed early, and the at-expiry payoff diagram says nothing useful about that moment. Before expiration a call is worth its intrinsic value plus its remaining time value, and for an out of the money call the entire premium is time value.
The Scenario Analysis sheet prices the contract with Black-Scholes at each point in the holding period. The grid below shows profit and loss on the five contract position, with implied volatility held constant.
| Stock price | Day 0 | Day 7 | Day 14 | Day 21 | Day 28 | Expiry |
|---|---|---|---|---|---|---|
| $275.34 | -$3,384 | -$3,487 | -$3,560 | -$3,596 | -$3,603 | -$3,603 |
| $290.63 | -$2,482 | -$2,799 | -$3,109 | -$3,390 | -$3,579 | -$3,603 |
| $305.93 | -$3 | -$513 | -$1,083 | -$1,749 | -$2,596 | -$3,603 |
| $321.23 | +$4,545 | +$4,063 | +$3,541 | +$2,969 | +$2,353 | +$2,012 |
| $336.52 | +$10,790 | +$10,478 | +$10,183 | +$9,928 | +$9,751 | +$9,657 |
| $351.82 | +$17,965 | +$17,787 | +$17,633 | +$17,506 | +$17,397 | +$17,307 |
Read across any row and the number falls. That fall is the cost of time, and it happens even when the price forecast is exactly right. Look at the $321.23 row: a 5% rise delivers $4,545 if it happens immediately and $2,012 if it happens on the last day. Same price, same contract, less than half the profit, purely because the time value has gone.
This is the practical lesson the expiry column teaches. For a bought call the expiry line is the worst case for value, not the base case. Every cell to the left of it is higher. A calculator that only draws the hockey stick is showing the least favourable moment in the position's life and calling it the answer.
The $305.93 row makes the same point from the other direction. If the stock simply does not move, the position bleeds from roughly break even to a total loss over 34 days, without the forecast ever being wrong about direction. It was only wrong about timing.
Strike selection: comparing the whole chain
The next question after "what does this cost" is usually "should I buy a cheaper strike". The Strike Comparison sheet prices ten AAPL calls on the same expiry so the tradeoff is visible in one place.
| Strike | Moneyness | Ask | Cost, 1 contract | Breakeven | Move to breakeven | Delta | Open interest | Cost per delta |
|---|---|---|---|---|---|---|---|---|
| $290 | In the money | $20.05 | $2,005.65 | $310.06 | +1.35% | 0.7783 | 9,448 | $25.76 |
| $295 | In the money | $16.20 | $1,620.65 | $311.21 | +1.72% | 0.7135 | 13,232 | $22.70 |
| $300 | In the money | $12.70 | $1,270.65 | $312.71 | +2.22% | 0.6368 | 27,367 | $19.94 |
| $305 | At the money | $9.70 | $970.65 | $314.71 | +2.87% | 0.5496 | 18,020 | $17.65 |
| $310 | Out of the money | $7.20 | $720.65 | $317.21 | +3.69% | 0.4581 | 20,162 | $15.72 |
| $315 | Out of the money | $5.25 | $525.65 | $320.26 | +4.68% | 0.3693 | 9,989 | $14.22 |
| $320 | Out of the money | $3.70 | $370.65 | $323.71 | +5.81% | 0.2873 | 35,293 | $12.88 |
| $325 | Out of the money | $2.65 | $265.65 | $327.66 | +7.10% | 0.2204 | 17,465 | $12.03 |
| $330 | Out of the money | $1.77 | $177.65 | $331.78 | +8.45% | 0.1607 | 18,812 | $11.01 |
| $340 | Out of the money | $0.89 | $89.65 | $340.90 | +11.43% | 0.0882 | 14,089 | $10.10 |
The $340 call costs $89.65 and the $290 call costs $2,005.65. The cheap one is not therefore the better value, and the columns explain why.
Move to breakeven is the honest price of a cheap strike. The $340 call needs an 11.43% move in 34 days to return anything at all. The $290 call needs 1.35%. The dollar cost fell by 96% and the required move rose by a factor of eight.
Cost per delta divides the premium by the share exposure it buys. Delta of 0.4581 on the 310 call means the contract behaves like roughly 46 shares of stock at this moment, so $720.65 buys about 46 shares of exposure, or $15.72 per unit of delta. On the 290 call the same measure is $25.76. Deep in the money calls cost more per unit of exposure because you are buying intrinsic value, which is not at risk of decaying. Far out of the money calls look cheap per unit of delta because that delta is fragile and disappears quickly when the stock moves the wrong way.
Open interest is the liquidity check, and it is not decoration. A contract with 9,989 open interest can be exited near the quoted price. A model result on a contract nobody trades is a theoretical profit.
Position sizing for something that can go to zero
A long call has a real and common outcome of total loss, so it must be sized on that assumption rather than on a percentage stop.
The Position Sizing sheet starts from an account value and a risk budget. On a $100,000 account with a 2% budget, the arithmetic runs as follows.
| Measure | Value |
|---|---|
| Dollar risk budget | $2,000.00 |
| Cost per contract | $720.65 |
| Maximum contracts inside budget | 2 |
| Capital at risk if held to zero | $1,441.30 |
| Share of portfolio at risk | 1.44% |
| Notional controlled by 2 contracts | $61,186 |
The risk ladder shows how quickly this scales.
| Risk budget | Contracts | Capital at risk |
|---|---|---|
| 0.5% | 0 | $0 |
| 1.0% | 1 | $720.65 |
| 2.0% | 2 | $1,441.30 |
| 3.0% | 4 | $2,882.60 |
| 5.0% | 6 | $4,323.90 |
The 0.5% row returning zero contracts is not a bug in the sheet. A $500 budget cannot buy a $720 contract, and rounding up to one contract would quietly double the intended risk. When a position cannot be sized inside the budget, the correct output is zero.
Note the notional column against the risk column. Two contracts put $1,441 at risk while controlling $61,186 of stock. Leverage is what makes small premiums behave like large positions, and it is why the risk budget matters more here than in a cash equity position.
The Greeks, and why theta accelerates
The five Greeks describe how the position responds to everything that is not the passage of a straight line.
| Greek | Value (per share) | What it means for this position |
|---|---|---|
| Delta | 0.4581 | The call gains about $0.46 for each $1.00 the stock rises. Across 500 shares the position behaves like 229 shares of AAPL. |
| Gamma | 0.0184 | Delta itself rises by about 0.018 per $1.00 move, so the position gets more sensitive as the stock climbs. |
| Theta | -$0.1387 | The contract loses about 14 cents of value per calendar day. On five contracts that is $69.33 a day. |
| Vega | $0.3703 | One point of implied volatility is worth about 37 cents per share, or $185 on the position. |
| Rho | $0.1238 | Interest rate sensitivity, small at 34 days to expiry. |
Theta is the Greek that surprises people, because it is not constant. The Greeks and Time Decay sheet re-prices the contract as expiry approaches, holding the stock at $305.93.
| Days remaining | Call value | Delta | Gamma | Theta per day | Position value |
|---|---|---|---|---|---|
| 34 | $7.2001 | 0.4581 | 0.0184 | -$0.1387 | $3,600.06 |
| 30 | $6.6305 | 0.4513 | 0.0196 | -$0.1464 | $3,315.23 |
| 20 | $5.0398 | 0.4280 | 0.0237 | -$0.1744 | $2,519.92 |
| 15 | $4.1144 | 0.4099 | 0.0272 | -$0.1973 | $2,057.19 |
| 10 | $3.0448 | 0.3816 | 0.0326 | -$0.2338 | $1,522.39 |
| 7 | $2.2932 | 0.3534 | 0.0380 | -$0.2699 | $1,146.59 |
| 3 | $1.0552 | 0.2718 | 0.0518 | -$0.3619 | $527.60 |
| 1 | $0.2622 | 0.1400 | 0.0603 | -$0.4153 | $131.08 |
The first 14 days of the holding period cost $2.1603 per share, or $1,080 on five contracts. The last 14 days cost $3.9142 per share, or $1,957. Decay in the final fortnight runs at roughly 1.8 times the rate of the opening fortnight, and 54% of the entire premium is consumed in those last two weeks if the stock does not move.
Gamma rising as theta rises is the same effect seen from another angle. Near expiry the contract becomes more reactive to price and more expensive to hold. That combination is why the last two weeks of a long call behave very differently from the first two.
One more item belongs on this list. An earnings date inside the holding period usually inflates implied volatility beforehand and collapses it afterwards. With vega at $0.3703, a five point drop in implied volatility takes about $925 off this position, independent of where the stock goes. The workbook pulls the next earnings date so that date is never a surprise.
Building the call option profit calculator with MarketXLS formulas
Every value above can be pulled into Excel rather than typed. These formulas are verified against the MarketXLS function documentation.
Start with the underlying and the contract symbol. Contract level functions need a properly formatted option symbol, and OptionSymbol builds one from plain inputs.
=QM_Last("AAPL")                                    Underlying last price
=OptionSymbol("AAPL", DATE(2026,9,18), "Call", 310) Builds the contract symbol
With that symbol in a cell, the contract quotes follow.
=Option_Bid(B17)              Bid price of the call
=Option_Ask(B17)              Ask price of the call, what a buyer pays
=Option_Last_Price(B17)       Last traded price
=Option_Openinterest(B17)     Open interest, the liquidity check
=Option_Volume(B17)           Contracts traded today
=Option_Expirationdate(B17)   Expiration date of the contract
The Greeks take the position parameters directly rather than the symbol.
=opt_Delta(305.93, 7.20, DATE(2026,9,18), "Call", 310)
=opt_Gamma(305.93, 7.20, DATE(2026,9,18), "Call", 310)
=opt_Theta(305.93, 7.20, DATE(2026,9,18), "Call", 310)
=opt_Vega(305.93, 7.20, DATE(2026,9,18), "Call", 310)
=opt_Rho(305.93, 7.20, DATE(2026,9,18), "Call", 310)
=opt_ImpliedVolatility(305.93, 7.20, DATE(2026,9,18), "Call", 310)
Volatility and flow context sit alongside them, and this is the block that tells you whether the premium is expensive relative to its own history.
=ImpliedVolatility30d("AAPL")        30 day implied volatility, as a decimal
=ImpliedVolatilityRank1y("AAPL")     Where implied volatility sits in its 1 year range
=StockVolatilityThirtyDays("AAPL")   30 day realized volatility
=opt_PutCallVolRatio("AAPL")         Put volume divided by call volume
=opt_PutCallOIRatio("AAPL")          Put open interest divided by call open interest
=earnings_date("AAPL")               Next scheduled earnings date
=Strikes("AAPL")                     Available strikes
=ExpirationNext("AAPL", 0)           Next expiration date
Implied volatility against realized volatility is the comparison that matters to a call buyer. Implied volatility sets the premium. Realized volatility is what the stock has actually done. When implied runs well above realized, the buyer is paying for movement that has not been happening.
The position arithmetic is then plain Excel, referencing the input cells so the whole workbook updates from one place.
Total cost      =B11*B10*100 + B15*B10
Breakeven       =B7 + (Total cost / (B10*100))
Move to break   =(Breakeven - B6) / B6
Payoff at price =MAX(0, Price - B7) * B10*100 - Total cost
The Black-Scholes valuation used in the scenario grid uses legacy Excel function names so it works in any version without the _xlfn prefix problem.
d1  =(LN(S/K)+(r-q+v^2/2)*T)/(v*SQRT(T))
d2  =d1-v*SQRT(T)
Call value =S*EXP(-q*T)*NORMSDIST(d1)-K*EXP(-r*T)*NORMSDIST(d2)
What is inside the template
The workbook has eight sheets. Yellow cells are inputs, and everything else is calculated from them.
| Sheet | What it does |
|---|---|
| How To Use | Explains each sheet and lists the MarketXLS functions used |
| Main Dashboard | Inputs, cost, breakeven, maximum loss, the five Greeks and the volatility context block |
| Payoff & Breakeven | Profit and loss at expiration across a price ladder, with the exact breakeven row highlighted |
| Scenario Analysis | Price against time grid, valuing the position before expiration as well as at it |
| Strike Comparison | Ten strikes side by side with cost, breakeven, required move, delta and open interest |
| Position Sizing | Contract count from account value and risk budget, plus a risk ladder |
| Greeks & Time Decay | The decay path from 34 days to 1 day, and the time value burn summary |
| Watchlist | Eight liquid names with implied volatility, breakeven and put to call ratios |
Every sheet carries a "MarketXLS Functions Used" box listing the exact formulas on that sheet, so the workbook doubles as a reference while you build your own.
The Watchlist sheet is a useful starting screen. Same expiry, near the money calls, across eight names.
| Ticker | Spot | Strike | Ask | Implied vol | Breakeven | Move to breakeven | Put/call volume |
|---|---|---|---|---|---|---|---|
| AAPL | $305.93 | $305 | $9.70 | 24.45% | $314.70 | +2.87% | 0.41 |
| MSFT | $495.40 | $495 | $15.95 | 25.75% | $510.95 | +3.14% | 1.83 |
| NVDA | $225.16 | $225 | $10.95 | 39.11% | $235.95 | +4.79% | 1.99 |
| AMZN | $262.65 | $265 | $8.25 | 28.78% | $273.25 | +4.04% | 0.36 |
| GOOGL | $345.90 | $345 | $13.00 | 29.40% | $358.00 | +3.50% | 0.22 |
| META | $589.85 | $590 | $24.70 | 34.01% | $614.70 | +4.21% | 1.04 |
| AMD | $514.39 | $510 | $39.90 | 58.26% | $549.90 | +6.90% | 0.81 |
| SPY | $776.34 | $776 | $12.93 | 13.30% | $788.93 | +1.62% | 2.91 |
The relationship between the implied volatility column and the move to breakeven column is the whole story of call buying. SPY at 13.30% implied volatility needs 1.62%. AMD at 58.26% needs 6.90%. High implied volatility raises the premium, which pushes the breakeven further away, which means the underlying has to work harder before the buyer sees anything.
Download the templates:
- Static Version (with MarketXLS formula reference) - Pre-filled with the 2026-08-15 data used throughout this article
- MarketXLS Formula Version - Live formulas that update on every refresh
Five mistakes a good calculator prevents
Treating the strike as the breakeven. The strike is where intrinsic value begins, not where the position turns positive. In this example those two prices are $7.21 apart.
Pricing off the mid. The mid is not a price anyone was offered. Model the ask when buying and the bid when selling.
Ignoring commissions. At $0.65 per contract the effect here is small, but it is not zero, and on small contracts bought in size it changes the breakeven meaningfully.
Reading only the expiry payoff. The at-expiry diagram is the least favourable snapshot of a long call's life. Positions closed early are usually worth more than that line suggests, and a calculator that cannot show day 7 cannot help you manage the trade.
Buying the cheapest strike. Low premium and low probability travel together. The move to breakeven column and the cost per delta column are the two that make that tradeoff visible.
Frequently asked questions
How do you calculate profit on a call option? Profit at expiration equals the intrinsic value at that price minus the total cost paid. Intrinsic value is the stock price minus the strike, floored at zero, multiplied by 100 shares per contract. In the worked example, at $330.00 the intrinsic value is $20.00 per share, which is $10,000 across five contracts, less the $3,603.25 paid, giving $6,396.75. Before expiration the calculation is different, because the contract still carries time value and needs an option pricing model rather than simple subtraction.
What is the breakeven price of a call option? Breakeven equals the strike price plus the total cost per share, including commissions. For the AAPL 310 call bought at $7.20 with $0.65 per contract in commission, the all in cost is $7.2065 per share and the breakeven is $317.21. The stock has to rise 3.69% from $305.93 within 34 days to reach it.
Can you lose more than you paid for a call option? No. A bought call carries a right and no obligation, so the maximum loss is the premium plus commissions. In this position that ceiling is $3,603.25 and it cannot grow, whatever the stock does. Selling calls is a different matter entirely and carries risk that is not capped in the same way.
Why is my call option losing money when the stock went up? Three effects can do this. Time decay removes value every day, and it accelerates near expiry, running at about $69 a day on this five contract position. A drop in implied volatility lowers the premium independently of price, and vega of $0.3703 means five points of implied volatility is worth about $925 here. Third, a small rise may simply be less than the decay over the same period. The Scenario Analysis sheet separates these effects by showing price and time on two different axes.
Which strike should a call buyer choose? That depends on the size of the move expected and the time available, and no calculator can decide it for you. What the Strike Comparison sheet does is make the tradeoff explicit: lower strikes cost more, need smaller moves and carry more delta per contract, while higher strikes cost less, need larger moves and lose value faster. Comparing the move to breakeven column against what the underlying has historically moved in a comparable period is a reasonable way to frame the question.
Does the calculator work for put options and spreads?
The workbook models long calls specifically, which keeps the arithmetic and the payoff logic clean. The same input cells and the same Black-Scholes block extend to puts by switching the option type argument in the opt_ functions from "Call" to "Put". The OptionXLS strategy library covers the multi leg structures, including the bull call spread and the long call in its own right.
How often does the template update? The formula version re-prices every time Excel recalculates, because each quote, Greek and volatility reading is a live MarketXLS function rather than a stored number. The sample version holds the 2026-08-15 values so the workbook can be reviewed offline.
The bottom line
A call option profit calculator earns its keep at the moment before a trade, not after it. The five numbers that matter are the total cost, the breakeven, the payoff at expiration, the value along the way, and the Greeks that explain what is moving. In the worked example those numbers say something specific: $3,603.25 buys 42 times leverage and needs a 3.69% move in 34 days, loses about $69 a day while it waits, and gives back more than half the premium to time decay in the final fortnight if the stock stands still.
None of that makes the trade good or bad. It makes it measurable, which is the only thing a spreadsheet can honestly offer. Everything here is educational analysis of how a long call behaves, not a recommendation to buy any contract, and options carry risks including the total loss of the premium.
Build it once against live data and the same workbook prices any ticker, any strike and any expiry you point it at.
- Explore the full function library at MarketXLS
- See it running on your own positions: book a demo
- Browse plans on the MarketXLS pricing page
- Work through the strategy library at OptionXLS