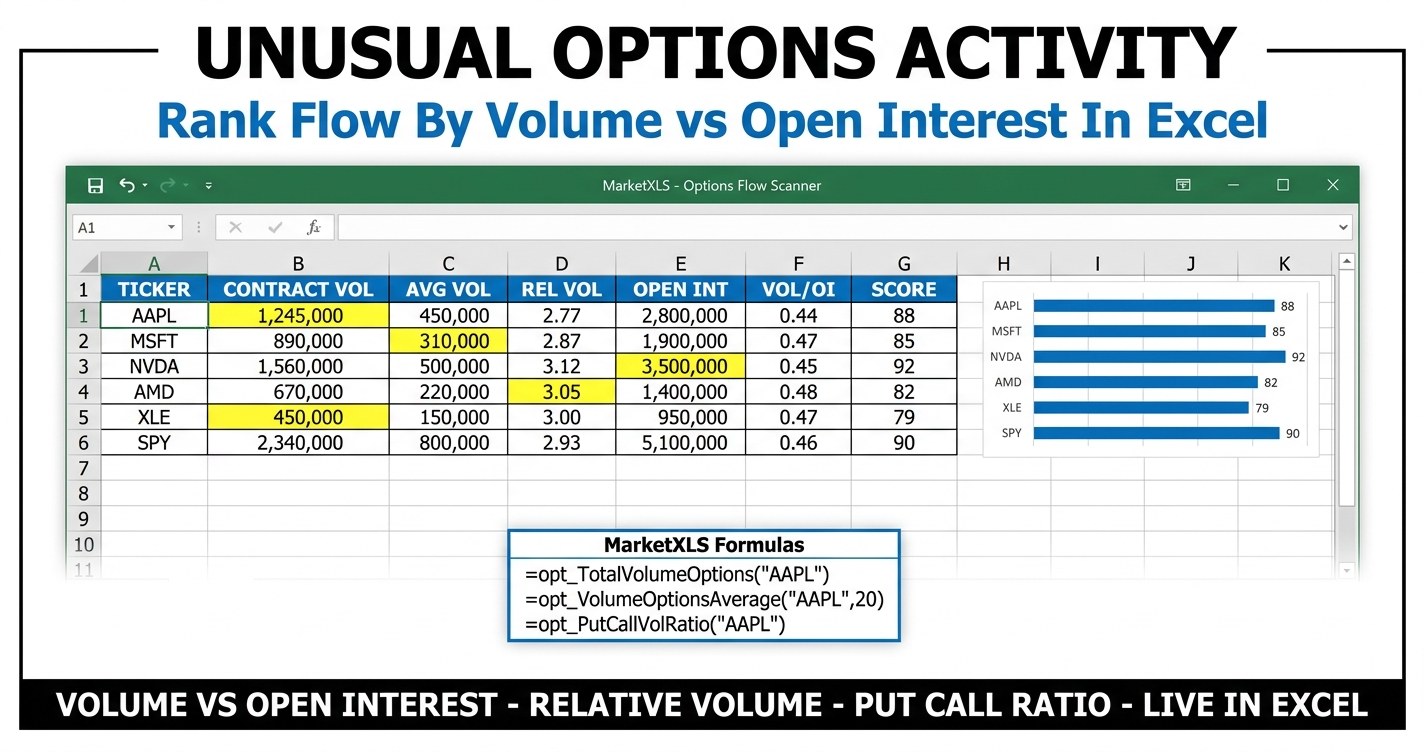
Unusual options activity gets reported almost everywhere as a single number: contracts traded. That number tells you a chain was busy. It does not tell you whether the session was busy for that particular name, and it does not tell you whether those contracts opened new positions or closed positions that already existed. Both questions have answers, and both are arithmetic that fits in a spreadsheet.
The gap matters because the two most common ways of presenting options flow are the two least informative. A raw volume leaderboard returns the same handful of index products and mega-cap names every single session, because those chains are always the largest. A dollar-premium leaderboard returns the same names for the same reason. Neither answers the only question worth asking, which is whether today looks different from a normal day in that specific underlying.
This guide builds a scanner that asks the harder question. It compares each name's options volume to its own 20-day average, tests today's volume against the open interest that existed before the session, checks where implied volatility sits inside its own one-year range, and combines the four into a documented 0-100 score. Every figure below comes from one snapshot of a twelve-name watchlist taken on 2026-08-15, with a reference expiration of 2026-09-18.
Unusual options activity, ranked: the snapshot
| Ticker | Sector | Options Volume | 20d Avg | Rel Vol | Vol/OI | Put/Call | IV Rank | Score | Flag |
|---|---|---|---|---|---|---|---|---|---|
| XLE | Energy | 288,400 | 71,900 | 4.01x | 0.14 | 0.43 | 63.5 | 70.4 | REVIEW |
| AMD | Technology | 704,900 | 188,600 | 3.74x | 0.15 | 0.38 | 55.8 | 69.2 | REVIEW |
| MU | Technology | 356,100 | 109,700 | 3.25x | 0.15 | 0.39 | 51.7 | 65.1 | REVIEW |
| PLTR | Technology | 612,700 | 204,100 | 3.00x | 0.16 | 0.36 | 48.9 | 64.0 | REVIEW |
| COIN | Financial Services | 441,600 | 138,200 | 3.20x | 0.16 | 0.48 | 58.3 | 63.9 | REVIEW |
| NVDA | Technology | 1,842,300 | 612,400 | 3.01x | 0.13 | 0.42 | 41.2 | 57.8 | REVIEW |
| SPY | Financial Services | 6,112,500 | 4,980,200 | 1.23x | 0.19 | 1.26 | 22.4 | 39.7 | WATCH |
| IWM | Financial Services | 1,204,600 | 968,300 | 1.24x | 0.12 | 1.40 | 29.4 | 33.5 | - |
| AAPL | Technology | 812,400 | 486,200 | 1.67x | 0.08 | 0.73 | 27.6 | 31.0 | - |
| XOM | Energy | 162,300 | 88,400 | 1.84x | 0.06 | 0.72 | 34.2 | 31.0 | - |
| MSFT | Technology | 402,800 | 241,500 | 1.67x | 0.08 | 0.72 | 24.1 | 30.6 | - |
| JPM | Financial Services | 148,900 | 102,600 | 1.45x | 0.07 | 0.83 | 19.8 | 25.5 | - |
Read the first and last rows against each other. SPY traded 6,112,500 contracts and XLE traded 288,400, a difference of more than twenty to one. On any raw volume leaderboard SPY sits at the top and XLE does not appear. Ranked against their own baselines, XLE had a four times session and SPY had a slightly above average one. The ranking inverts completely, and the inverted version is the one that carries information.
What the raw contract count leaves out
Options volume is a count of contracts that changed hands. It is published by the exchanges, it is accurate, and on its own it is close to useless for comparison across names. Three separate problems sit inside it.
The first is scale. A chain's normal volume is a function of the underlying's market capitalisation, its retail following, its index membership and how many market makers quote it. Comparing NVDA's volume to XLE's volume compares those structural facts, not today's behaviour.
The second is direction. Exchange volume carries no buy or sell flag. When a print crosses at the ask it is often described as bought, but that inference comes from comparing the trade price to the quote at that instant, and it fails routinely on multi-leg orders, on prints that improve inside the spread, and on any trade where the market maker was the initiator. No public consolidated feed labels a trade as bought or sold.
The third is intent. A large call print can be an outright directional position, one leg of a spread, a roll of an expiring position into a later month, a hedge against a short stock position held elsewhere, or a covered call written against stock the trader already owns. The tape looks identical in all five cases.
None of those problems disappear in a spreadsheet. What a spreadsheet can do is stop the first one from contaminating everything, and put a rough handle on the third.
Relative volume: measuring a name against itself
Relative volume divides today's total options volume by the same underlying's own average options volume over a trailing window. In the workbook the window is twenty sessions, which is roughly one calendar month of trading and long enough to absorb a single busy day without being so long that a changed regime never shows up.
Two MarketXLS functions produce it:
=opt_TotalVolumeOptions("XLE")            → 288,400
=opt_VolumeOptionsAverage("XLE",20)       → 71,900
=opt_TotalVolumeOptions("XLE") / opt_VolumeOptionsAverage("XLE",20)   → 4.01
The second argument on opt_VolumeOptionsAverage is the lookback in days, so a 5, 10 or 60 day baseline is a single edit. A short window makes the scanner twitchy and a long one makes it slow to notice a regime change, and there is no correct answer. Twenty is a defensible default rather than an optimal one.
The same function splits by side when you pass an option type:
=opt_TotalVolumeOptions("XLE","C")        → call volume only
=opt_TotalVolumeOptions("XLE","P")        → put volume only
=opt_VolumeOptionsAverage("XLE",20,"C")   → 20-day average call volume
That split matters more than it first appears. A name can print three times its normal total volume while the call and put sides both simply doubled, which usually means volatility is being traded rather than direction. Comparing each side to its own baseline separates those cases.
Volume against open interest: the opening risk test
Open interest counts contracts that exist. It updates once per day, overnight, after the clearing house reconciles the session. Volume counts contracts that traded. Dividing one by the other gives a rough read on whether today's activity created new positions or unwound existing ones.
The logic is simple. If a strike carried 9,600 contracts of open interest at yesterday's close and 52,800 contracts traded in it today, then most of that volume cannot have been closing trades, because there were not enough positions to close. Something new was opened. If the same strike carried 190,000 contracts of open interest and 52,800 traded, the session is entirely consistent with position maintenance and tells you very little.
=opt_TotalOpenInterestOptions("XLE")                  → whole-chain open interest
=opt_TotalOpenInterestOptions("XLE","C")              → call open interest only
=Option_OpenInterest(OptionSymbol("XLE","2026-09-18","Call",100))   → one contract
The scale of this ratio depends entirely on where you measure it, and this is where most home-built scanners go wrong. Across a whole chain, total open interest is always far larger than any single session's volume, so whole-chain volume divided by whole-chain open interest lands between roughly 0.05 and 0.25 even on genuinely unusual days. At the level of an individual strike the same ratio routinely runs above 1.0. A threshold of 0.60 is meaningless at the chain level and reasonable at the contract level, so the workbook carries two separate inputs rather than one.
Here is the contract-level view of the same session, which is where the ratio does its real work:
| Contract | Volume | Open Interest | Vol/OI | Implied Vol | Delta | Premium Traded |
|---|---|---|---|---|---|---|
| XLE 100 Call | 52,800 | 9,600 | 5.50 | 31.8% | 0.298 | $7,497,600 |
| PLTR 175 Call | 96,400 | 18,200 | 5.30 | 56.1% | 0.313 | $42,030,400 |
| MU 155 Call | 58,600 | 14,100 | 4.16 | 50.2% | 0.324 | $23,557,200 |
| AMD 175 Call | 88,600 | 21,400 | 4.14 | 48.8% | 0.351 | $45,363,200 |
| COIN 340 Call | 47,900 | 12,800 | 3.74 | 61.1% | 0.367 | $46,654,600 |
| NVDA 190 Call | 142,800 | 38,600 | 3.70 | 41.2% | 0.342 | $69,258,000 |
| NVDA 165 Put | 61,200 | 44,800 | 1.37 | 43.4% | -0.247 | $24,112,800 |
| NVDA 200 Call | 118,400 | 91,200 | 1.30 | 42.9% | 0.218 | $30,902,400 |
| SPY 760 Put | 214,600 | 188,400 | 1.14 | 16.4% | -0.300 | $132,622,800 |
| AMD 185 Call | 74,100 | 68,900 | 1.08 | 50.3% | 0.233 | $21,340,800 |
| AAPL 260 Call | 102,400 | 96,800 | 1.06 | 24.2% | 0.283 | $33,484,800 |
| XLE 90 Put | 21,300 | 28,400 | 0.75 | 32.6% | -0.293 | $3,961,800 |
Note the two SPY and XLE rows in particular. The SPY 760 put is by far the largest premium figure in the table at over $132 million, and it has the second lowest volume against open interest reading. A very large amount of money moved through a strike that already held a very large position. That is what routine index hedging looks like, and it is the single most common false positive in options flow analysis.
The XLE 100 call is the opposite: a modest $7.5 million of premium against almost no existing open interest. It is the smallest premium figure among the flagged contracts and the strongest opening-risk reading in the table.
Premium traded is worth computing for exactly this reason. It converts a contract count into dollars:
=Option_Volume(E5) * Option_Last_Price(E5) * 100
Without it, a 142,800 lot in a $4.85 option and a 21,300 lot in a $1.86 option look like wildly different events when the second is a rounding error next to the first.
Confirming with the next day's open interest
Volume against open interest is an inference made during the session. The confirmation arrives the following morning, when open interest updates. If 52,800 contracts traded in a strike that held 9,600, and the next day's open interest prints near 60,000, the flow genuinely opened. If it prints near 10,000, the position was opened and closed inside the session, which usually means a market maker was working through inventory rather than anyone taking a view.
That check costs one function call:
=opt_UnusualOptionOIScanEOD(15)
=opt_OptionsChangeInOILeaders(10)
Very few retail-facing flow tools run this confirmation, because it arrives a day late and a day late is unglamorous. It is also the only step in the entire process that converts an inference into something closer to a fact.
Implied volatility as price context
Volume tells you how much traded. Implied volatility rank tells you what it cost. Unusual volume arriving with implied volatility already near the top of its one-year range means the flow paid up for exposure. The same volume with implied volatility near the bottom means it did not.
=ImpliedVolatilityRank1y("XLE")     → 63.5
=ImpliedVolatility30d("XLE")        → 30-day implied volatility
=ImpliedVolatilityPct1y("XLE")      → percentile rather than range position
Rank and percentile are different measures and both are useful. Rank places current implied volatility inside the high-low range of the past year. Percentile counts what share of days over the past year sat below today's reading. A name that spent eleven months quiet and one month violent will show a low rank and a high percentile, and the disagreement between the two is itself informative. There is more on reading these figures in the implied volatility calculator guide.
The put and call split, and its limits
The put-call volume ratio is the most quoted and most over-read number in options flow.
=opt_PutCallVolRatio("XLE")    → 0.43
=opt_PutCallOIRatio("XLE")     → the same split across standing positions
XLE at 0.43 means roughly two calls traded for every put. That is a genuine skew in activity. It is not evidence that anyone is bullish, because the ratio counts contracts on each side without knowing who initiated them or why. Calls are bought by people expecting a rise and sold by people harvesting premium against stock they own, and both show up identically in the numerator.
What the ratio does reliably is flag lopsidedness. In the snapshot above, six names sit between 0.36 and 0.48 while SPY and IWM sit at 1.26 and 1.40. The single-name activity was concentrated on the call side and the index activity on the put side, which is the ordinary shape of a session where index hedges are being maintained while single-name speculation runs elsewhere. That contrast is worth noticing. Any conclusion beyond it is not supported by the data.
Building the composite score
Four inputs, four weights, one number between 0 and 100:
| Component | Weight | Caps at | Rationale |
|---|---|---|---|
| Relative volume | 40 | 5.0x | The most informative single input, and the one that survives comparison across market caps |
| Volume / open interest | 30 | 0.25 at chain level | Separates opening risk from position maintenance |
| IV rank | 15 | 100 | Context for what the flow paid |
| Side lean | 15 | 1.1 log units | Balanced splits usually mean spreads or hedges, not views |
The formula, exactly as it sits in the workbook:
=ROUND( MIN(RelVol/5,1)*40 + MIN(VolOI/0.25,1)*30
      + MIN(MAX(IVRank,0)/100,1)*15
      + MIN(ABS(LN(MAX(PutCall,0.05)))/1.1,1)*15 , 1)
The side lean term uses a natural logarithm so that a put-call ratio of 0.5 and a ratio of 2.0 score identically. Both are equally lopsided, one toward calls and one toward puts, and a score that treats lopsidedness as directional is smuggling in an opinion the data does not support.
Every weight in that table is a choice rather than a discovery. They are written into a sheet with yellow input cells specifically so they can be argued with and changed.
Threshold discipline
A scanner that flags forty names a session has not screened anything. The workbook includes a sheet that counts how many names survive at seven different threshold pairs, run against the same snapshot:
| Setting | Rel Vol min | Vol/OI min | Names passing | % of watchlist |
|---|---|---|---|---|
| Everything | 1.0x | 0.00 | 12 | 100% |
| Loose | 1.5x | 0.06 | 8 | 67% |
| Moderate | 2.0x | 0.09 | 6 | 50% |
| Standard | 3.0x | 0.12 | 6 | 50% |
| Tight | 3.5x | 0.13 | 2 | 17% |
| Very tight | 4.0x | 0.14 | 1 | 8% |
| Extreme | 5.0x | 0.20 | 0 | 0% |
Two things in that ladder are worth reading carefully. Moderate and Standard both return six names, which means that between 2.0x and 3.0x relative volume this particular watchlist has a gap, and tightening the threshold across that range buys nothing. And Extreme returns zero, which is correct behaviour rather than a broken filter. A threshold that never returns zero is not a threshold.
Pick the row that produces a count you can genuinely research before the next session opens. For most people working alone that is between two and six names, which puts the honest setting somewhere between Standard and Tight.
Market-wide scans when the watchlist is quiet
A twelve-name watchlist will be flat on plenty of days. MarketXLS exposes the whole-market versions of the same screens, each returning a table that spills into the sheet:
=opt_UnusualStockOptionsActivity(15)     → 15 underlyings, ranked by unusual activity
=opt_UnusualOptionVolScanEOD(15)         → end-of-day contract volume outliers
=opt_UnusualOptionOIScanEOD(15)          → end-of-day open interest outliers
=opt_UnusualOptionVolOIScanEOD(15)       → the combined volume against OI screen
=opt_OptionsVolumeLeaders(10)            → raw volume leaders
=opt_OptionsChangeInVolumeLeaders(10)    → largest day-over-day volume changes
=opt_OptionsOILeaders(10)                → largest standing positions
=opt_OptionsChangeInOILeaders(10)        → largest day-over-day open interest builds
The fourth of those, opt_UnusualOptionVolOIScanEOD, is the closest single call to what the workbook computes by hand, and it is the sensible starting point on a day with no obvious candidates. The two leaders functions at the top of the list are the raw leaderboards discussed earlier. They are useful as a liquidity check and weak as a signal, and they are included so the difference between the two approaches is visible side by side.
Each of these returns a spilled array, so leave the rows beneath the formula empty or Excel returns a spill error.
Dropping to the contract level
Once a name is flagged, the underlying-level numbers have done their job and the question moves to which strikes actually traded.
=TopOptionsByVolume("AMD",20)             → the 20 busiest contracts
=TopOptionsByOpenInterest("AMD",20)       → the 20 largest standing positions
=ExpirationNext("AMD",1)                  → next listed expiration
=QM_GetOptionQuotesAndGreeks("AMD")       → full chain with Greeks
=QM_GetOptionMarketStats("AMD")           → chain-level option statistics
For a specific contract, build the OCC symbol and read it directly:
=OptionSymbol("AMD","2026-09-18","Call",175)    → AMD260918C00175000
=Option_Volume(E5)
=Option_OpenInterest(E5)
=Option_Last_Price(E5)
=Option_Bid(E5)
=Option_Ask(E5)
Reading bid and ask separately is not optional here. A flagged contract in a name with a wide spread can cost noticeably more to enter than the last price suggests, and a screen that reports mid prices reports a position nobody can open at that price.
The Greeks come from the same five inputs, with implied volatility backed out of the contract price:
=opt_ImpliedVolatility(QM_Last("AMD"),5.12,"2026-09-18","Call",175)
=opt_Delta(QM_Last("AMD"),5.12,"2026-09-18","Call",175)
=opt_Gamma(QM_Last("AMD"),5.12,"2026-09-18","Call",175)
=opt_Theta(QM_Last("AMD"),5.12,"2026-09-18","Call",175)
=opt_Vega(QM_Last("AMD"),5.12,"2026-09-18","Call",175)
Delta is the number that turns a flag into a risk figure. A position that costs one percent of an account to open can carry six figures of directional exposure once contract delta is multiplied by contract count and by the underlying price. The workbook computes that notional column deliberately next to the premium column, because the two tell very different stories about the same trade.
Grouping by sector before counting flags
If six names flag and four of them are semiconductors, that is one theme rather than six independent observations. The workbook groups the watchlist by sector using =Sector("AMD") and aggregates volume, baseline and side split within each group. It also computes an aggregate relative volume across the entire watchlist. When that aggregate sits above roughly 1.5, the whole tape is busy and individual flags carry proportionally less information. In the snapshot above, watchlist volume of 13,089,500 against a combined baseline of 8,192,100 gives an aggregate of 1.60, which is exactly the situation where a scanner should be read with more caution rather than less.
What this analysis cannot tell you
Worth stating plainly, because the gap between what flow data supports and what it gets used for is where most of the damage happens:
- Whether any contract was bought or sold. No public consolidated feed carries that flag.
- Whether a trade opened or closed a position. Volume against open interest is an inference, confirmed only by the next day's open interest print.
- Whether a print was one order or four hundred small ones.
- Whether the contract is one leg of a spread, a roll, or a hedge against a position held somewhere else entirely.
- Whether the trader knows anything. Most large options prints are hedges placed by people with no view on direction at all.
- Anything whatsoever about future price.
A high score means look closer. It does not mean act. Nothing in this article or the attached workbook is a recommendation to buy or sell any security, and no threshold, weight or setting described here is represented as profitable.
What is in the template
Ten sheets, built around the arithmetic above:
| Sheet | Contents |
|---|---|
| Cover | Edition, data date, reference expiration, sheet index |
| How To Use | How to read each ratio, and what each one cannot tell you |
| Inputs | Watchlist, both volume/OI thresholds, relative volume threshold, account size, risk per idea |
| Flow Scanner | The main dashboard, twelve names ranked by composite score, with data bars and a ranking chart |
| Contract Detail | Strike-level volume, open interest, volume/OI, implied volatility, Greeks and premium traded |
| Market Scans | The eight whole-market unusual activity and leader functions |
| Threshold Scenarios | Live count of names surviving at seven threshold pairs |
| Position Sizing | Contract count, premium at risk, position delta and notional exposure from account size |
| Sector Comparison | Sector aggregation plus the whole-watchlist relative volume cross-check |
| Scoring Method | Every weight, every cap, and the reasoning behind each |
The static edition carries a snapshot dated 2026-08-15 with a MarketXLS Formula column on each sheet showing the exact function behind every value. The formula edition replaces every data cell with a live function and recalculates against the current session. Both editions list the functions used at the bottom of each sheet.
Download the templates:
- Static Version (with MarketXLS formula reference) - Pre-filled with the 2026-08-15 snapshot
- MarketXLS Formula Version - Live-updating formulas
Frequently asked questions
What counts as unusual options activity?
There is no standard definition, which is why the threshold sheet exists. The workbook treats a name as unusual when its options volume is at least three times its own 20-day average and the whole chain turned over at least 12 percent of its open interest. Both figures are inputs you can change. Any tool that presents a single fixed definition without showing you the threshold is hiding a choice it made on your behalf.
Is a high volume to open interest ratio bullish?
No. It suggests the flow opened new positions rather than closing old ones, and says nothing about direction. A volume/OI reading of 5.5 on a call strike is equally consistent with someone buying calls for upside and someone writing calls against stock they already hold. Direction is the one thing this ratio never contains.
Why measure options volume against a 20-day average instead of a fixed number?
Because a fixed contract threshold only ever surfaces the largest chains. Set it at 100,000 contracts and you get index products and mega-caps every session regardless of what happened. Measured against its own baseline, a mid-cap having a genuinely extraordinary day outranks a mega-cap having an ordinary one, which is the comparison worth making.
Can I run this without a live options data feed?
The arithmetic works on any options data with volume and open interest fields, including a manual copy from an end-of-day source. What changes is the effort. The formula edition refreshes on recalculation, so a twelve-name watchlist takes seconds. Rebuilding the same figures by hand each session takes long enough that most people stop after a fortnight.
How is this different from a put-call ratio screen?
A put-call ratio screen answers which side was busy. It cannot tell you whether the session was busy at all relative to normal, and it cannot separate opening from closing activity. In this workbook the put-call split carries fifteen of the hundred available points, which is roughly the weight the underlying data supports.
Should I trade a contract because it flagged?
No. A flag is a research prompt. The sensible next steps are checking whether an earnings date, an index rebalance, a dividend or a corporate action explains the activity, whether the next morning's open interest confirms a position was actually opened, and whether the bid-ask spread makes the contract tradeable at all. Most flags resolve into a mundane explanation, and the ones that do not are still not predictions.
The bottom line
Unusual options activity becomes useful at the point where it stops being a contract count and starts being a comparison. Volume against a name's own baseline removes the market-cap bias that makes raw leaderboards useless. Volume against open interest gives a rough separation between opening risk and position maintenance, confirmed by the next day's open interest. Implied volatility rank supplies the price context. The put-call split supplies a limited read on lopsidedness and nothing more.
Combining those four into a score with visible weights is not sophisticated, and that is deliberate. Every input is a MarketXLS function you can inspect, every weight sits in a yellow cell you can change, and every limitation is written on the sheet next to the number it applies to. A scanner you can argue with is worth considerably more than one that hands you a ranking and hides the reasoning.
Explore the full options function set at MarketXLS, see the plans at MarketXLS pricing, or book a demo to see the unusual activity scans running against a live chain. For related workbooks, see the straddle calculator guide and the historical options data guide.