Option payoff calculator output should be numbers, not a picture. A diagram shows the shape of a position. It does not tell you where each breakeven sits to the cent, what the worst case costs in dollars, or how many contracts that worst case allows against the account you actually have. Those are the figures that decide whether to commit capital, and a chart is the worst way to deliver them.
Most free calculators handle one leg. You type a strike and a premium, and they return breakeven as strike plus premium. That formula is correct, and it is correct for exactly one case: a single naked option. The moment you add a second leg it stops being the answer, and by the time you have four legs it is not even the right shape of answer, because the position now has two breakevens rather than one.
This is a calculator for the multi-leg case. It takes up to four option legs plus an optional stock position, and it returns the full description: net cash, maximum profit, maximum loss, every breakeven, reward to risk, and the win rate the structure would need just to hold even. Every figure below comes from a live SPY chain expiring 18 September 2026, captured on 15 August 2026 with SPY at $776.34 and 34 days left.
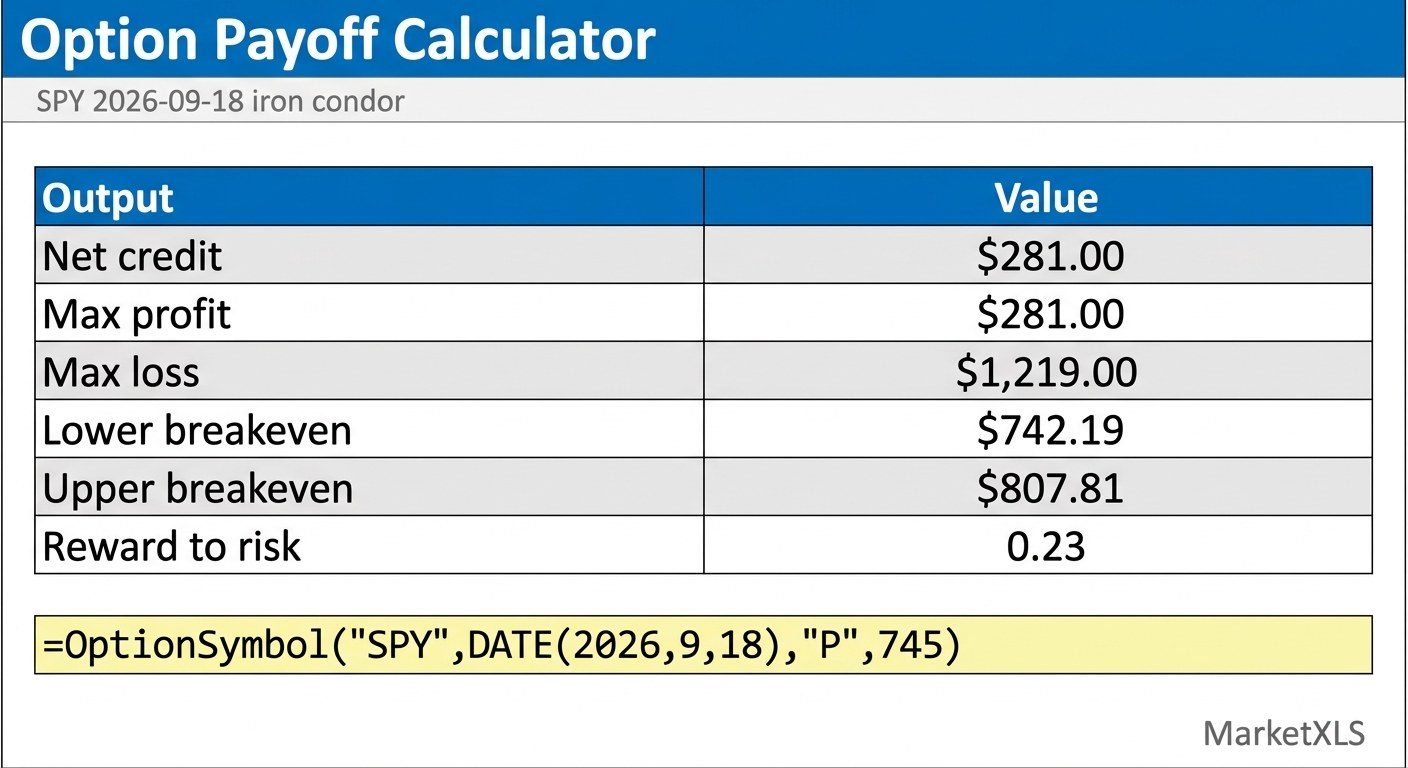
Option payoff calculator output for a four leg position
Here is the whole answer for the worked example, a SPY iron condor built from four real contracts. This is what the calculator prints before you place anything.
| Output | Value |
|---|---|
| Net credit received | $281.00 |
| Maximum profit | $281.00 |
| Maximum loss | $1,219.00 |
| Lower breakeven | $742.19 |
| Upper breakeven | $807.81 |
| Profit window width | 65.62 points, or 8.45% of spot |
| Reward to risk | 0.23 |
| Breakeven win rate | 81.27% |
| Return on risk at maximum profit | 23.05% |
Two of those rows are the reason to run the calculation at all. Reward to risk of 0.23 means the structure risks $1,219 to make $281. That is not a flaw in the trade, it is simply what a wide condor is: a high probability of a small gain against a low probability of a larger loss. The breakeven win rate row turns that into the question you can actually judge. This position has to finish between $742.19 and $807.81 on 81.27% of expirations just to end up flat over many repetitions.
You cannot get that number from a payoff diagram. You get it from maximum loss divided by the sum of maximum loss and maximum profit, and you need both extremes computed correctly to compute it at all.
The four legs, priced from the live chain
The structure sells a put spread below the market and a call spread above it. Every premium is the mid of a real two sided market.
| Leg | Contract | Bid | Ask | Mid | Implied vol | Open interest |
|---|---|---|---|---|---|---|
| Short | SPY 745 put | $3.79 | $3.82 | $3.805 | 15.93% | 14,687 |
| Long | SPY 730 put | $2.46 | $2.48 | $2.470 | 17.84% | 40,874 |
| Short | SPY 805 call | $2.09 | $2.11 | $2.100 | 11.00% | 5,068 |
| Long | SPY 820 call | $0.62 | $0.63 | $0.625 | 10.88% | 33,603 |
Net credit per share is 3.805 minus 2.470 plus 2.100 minus 0.625, which is 2.81. Times one hundred shares per contract, that is the $281.00 in the table above. Both wings are 15 points wide, so maximum loss is 15 minus 2.81, or 12.19 per share, which is $1,219.
Notice the implied volatilities. The 730 put carries 17.84% while the 820 call carries 10.88%. That skew is not a data error, it is the normal shape of an index chain, and it is why the put side of a condor collects more premium than the call side at equal distance. The calculator does not need you to understand skew to work, but the numbers it returns will make more sense if you can see it.
Where the strike plus premium shortcut breaks
This is the part that separates a real payoff calculator from a form with two input boxes.
A payoff curve is piecewise linear. It bends only at a strike, so between any two adjacent strikes it is a straight line. That single property tells you exactly where breakevens can live: on a strike, or strictly between two neighbouring strikes. Nowhere else.
So the correct method is a segment scan. List the strikes in order, add a point well below the lowest and well above the highest, then walk the segments one at a time. For each segment, compute profit and loss at both ends. If the sign changes across the segment, a breakeven is inside it, and because the segment is a straight line you can solve it directly. If the sign does not change, there is no breakeven there and you move on.
Run that over the iron condor and the scan reports two crossings:
| Segment | Left price | Right price | P&L at left | P&L at right | Sign change | Breakeven |
|---|---|---|---|---|---|---|
| 1 | $365.00 | $730.00 | -$1,219.00 | -$1,219.00 | No | none |
| 2 | $730.00 | $745.00 | -$1,219.00 | +$281.00 | Yes | $742.19 |
| 3 | $745.00 | $805.00 | +$281.00 | +$281.00 | No | none |
| 4 | $805.00 | $820.00 | +$281.00 | -$1,219.00 | Yes | $807.81 |
| 5 | $820.00 | $1,230.00 | -$1,219.00 | -$1,219.00 | No | none |
The scan does not know or care that this is a condor. Feed it a single long call and it finds one crossing. Feed it a butterfly and it finds two. Feed it a ratio structure and it can find three. That indifference is the whole value of doing it this way, because it means the calculator does not need a separate formula per strategy name.
Compare that to the shortcut. Strike plus premium on the short put leg gives 745 minus 2.81, which is $742.19, and it happens to be right. Apply the same idea to the call side and you get 805 plus 2.81, or $807.81, also right. The shortcut works here only because a condor is symmetric in structure. Change one wing width, add a fifth leg, or make the quantities unequal, and the arithmetic that produced those two numbers no longer generalises, while the segment scan is unchanged.
Building the engine in Excel
The calculator sheet has four leg rows. Each row holds an action, a type, a strike and a premium, and everything else is derived.
The sign of a leg comes from the action, so a blank row contributes nothing and the same formulas work whether you have one leg or four:
=IF(B12="Buy",1,IF(B12="Sell",-1,0))
Cash flow for the leg is negative when you pay and positive when you collect, scaled by contract count:
=-F12*E12*100*$B$9
Intrinsic value at any underlying price is the only piece that knows about calls and puts:
=IF(C12="Call",MAX(0,$B$4-D12),IF(C12="Put",MAX(0,D12-$B$4),0))
Profit and loss for the leg at a test price is then the sign times intrinsic minus premium, times one hundred, times contracts. Sum the four leg columns and you have the position. That is the entire engine. Everything else in the workbook, including the breakeven scan and the sizing sheet, reads off those columns.
For live premiums rather than typed ones, the leg rows pull from the chain. MarketXLS builds the contract symbol first, then quotes it:
=OptionSymbol("SPY",DATE(2026,9,18),"P",745)
=(Bid(OptionSymbol("SPY",DATE(2026,9,18),"P",745))+Ask(OptionSymbol("SPY",DATE(2026,9,18),"P",745)))/2
The underlying price, days to expiry and open interest come from:
=QM_Last("SPY")
=OPT_DaysToExpiration(OptionSymbol("SPY",DATE(2026,9,18),"C",805))
=QM_OpenInterest(OptionSymbol("SPY",DATE(2026,9,18),"C",805))
Greeks use the eight argument form, which takes spot, the market option price, expiry, type, strike, and then optional rate, dividend yield and sigma:
=opt_Delta(776.34,2.10,"2026-09-18","Call",805,0.04,0.0206)
=opt_Gamma(776.34,2.10,"2026-09-18","Call",805,0.04,0.0206)
=opt_Theta(776.34,2.10,"2026-09-18","Call",805,0.04,0.0206)
=opt_Vega(776.34,2.10,"2026-09-18","Call",805,0.04,0.0206)
Leave the final sigma argument off and MarketXLS solves implied volatility from the market price you passed in. Supply it and the function prices off your own number instead. Both behaviours are useful, and the template uses the first.
The payoff ladder
Breakevens and extremes describe the corners. The ladder fills in everything between them, one column per leg so you can see which leg is carrying the position at each price.
| SPY at expiry | Short 745 put | Long 730 put | Short 805 call | Long 820 call | Net P&L | Return on risk |
|---|---|---|---|---|---|---|
| $700 | -$4,119.50 | +$2,753.00 | +$210.00 | -$62.50 | -$1,219.00 | -100.0% |
| $730 | -$1,119.50 | -$247.00 | +$210.00 | -$62.50 | -$1,219.00 | -100.0% |
| $740 | -$119.50 | -$247.00 | +$210.00 | -$62.50 | -$219.00 | -18.0% |
| $745 | +$380.50 | -$247.00 | +$210.00 | -$62.50 | +$281.00 | +23.1% |
| $776 | +$380.50 | -$247.00 | +$210.00 | -$62.50 | +$281.00 | +23.1% |
| $805 | +$380.50 | -$247.00 | +$210.00 | -$62.50 | +$281.00 | +23.1% |
| $815 | +$380.50 | -$247.00 | -$790.00 | -$62.50 | -$719.00 | -59.0% |
| $820 | +$380.50 | -$247.00 | -$1,290.00 | -$62.50 | -$1,219.00 | -100.0% |
| $860 | +$380.50 | -$247.00 | -$5,290.00 | +$3,937.50 | -$1,219.00 | -100.0% |
Two things are worth reading carefully. First, the flat top runs from $745 all the way to $805, a 60 point stretch where the result is identical. Inside that band the position does not care where SPY lands. Second, look at the $860 row. The short 805 call is losing $5,290 on its own, and the long 820 call is up $3,937.50. The wing is doing its job, which is the difference between a defined risk structure and an undefined one.
Six structures on the same chain
The same engine prices anything you point it at. All six of these use the same SPY expiry, so the comparison is clean.
| Structure | Legs | Net cash | Max profit | Max loss | Breakevens | R:R |
|---|---|---|---|---|---|---|
| Iron condor | Short 745p, long 730p, short 805c, long 820c | $281 credit | $281 | $1,219 | $742.19 and $807.81 | 0.23 |
| Long straddle | Long 775 call and 775 put | $2,425.50 debit | Unlimited | Unlimited | $750.74 and $799.26 | n/a |
| Bull call spread | Long 775 call, short 795 call | $913.50 debit | $1,086.50 | $913.50 | $784.13 | 1.19 |
| Cash secured put | Short 760 put | $623.50 credit | $623.50 | $37,376.50 | $753.77 | 0.02 |
| Call butterfly | Long 765c, short two 780c, long 795c | $400 debit | $1,100 | $400 | $769.00 and $791.00 | 2.75 |
| Collar | Long 100 shares, long 760 put, short 795 call | $77,821.50 debit | $1,678.50 | $1,821.50 | $778.21 | 0.92 |
Three of the six have two breakevens. That is the practical case for the segment scan in one line.
A few of these rows deserve a note. The straddle shows unlimited on both ends because the scan detects that the payoff line still has slope at the edge of the range, so no cap exists in either direction. The cash secured put shows a $37,376.50 maximum loss because that is what the position loses if SPY goes to zero, which is the honest way to state it even though it is a remote outcome. The collar's net cash is large because it includes buying the shares; the option overlay by itself is a net debit of $187.50, and $776.34 plus $1.875 is the $778.21 breakeven.
These are descriptions of mechanics, not recommendations. Nothing here says which structure suits any objective.
The volatility input, and one thing to check
Every implied volatility quoted above was solved from each contract's own mid price, and that is worth a paragraph because it is where these models usually go wrong.
Option data feeds publish an implied volatility column, and it is tempting to use it. The problem is that a published IV was solved under some forward assumption you cannot see. If your model uses a different forward, the vendor IV will not reprice the market mid, and the error is systematic rather than random. On this SPY chain the vendor figures were roughly 0.6 points too low on the puts and 0.2 points too high on the calls, which is the classic sign flipped pattern of a forward mismatch.
The fix costs three steps. Solve the forward from put call parity at the most liquid strike that has both a call and a put, using F equals K plus the call mid minus the put mid, divided by the discount factor. Back out the carry from the forward. Then re-solve every leg's implied volatility from its own mid.
For this chain the anchor was the 775 strike, which returned a forward of $777.7452 against a spot of $776.34, implying a carry of 2.06%. The headline dividend yield is roughly half that, so using the headline number would have introduced exactly the error described above.
There is a free check on the work. At the anchor strike, the call and the put must solve to the same implied volatility, because put call parity ties them together. Both came out at 12.8256%. If yours differ by more than rounding, the forward is wrong and everything downstream inherits the error.
Turning maximum loss into a contract count
A defined risk structure makes sizing arithmetic rather than judgement, because the broker holds exactly the maximum loss and you already computed it.
| Risk per trade | Risk budget | Contracts | Capital at risk | Max profit if held | Share of account |
|---|---|---|---|---|---|
| 0.5% | $500 | 0 | $0 | $0 | 0.0% |
| 1.0% | $1,000 | 0 | $0 | $0 | 0.0% |
| 1.5% | $1,500 | 1 | $1,219 | $281 | 1.2% |
| 2.0% | $2,000 | 1 | $1,219 | $281 | 1.2% |
| 2.5% | $2,500 | 2 | $2,438 | $562 | 2.4% |
| 3.0% | $3,000 | 2 | $2,438 | $562 | 2.4% |
| 5.0% | $5,000 | 4 | $4,876 | $1,124 | 4.9% |
The table assumes a $100,000 account. The zeros in the first two rows are informative rather than a bug: at a strict 1% risk limit, a single contract of this structure does not fit, and the honest output is that you cannot take the trade at that size rather than a fractional contract. Change the structure to narrower wings and maximum loss falls, so the contract count rises. The sizing sheet reads maximum loss straight from the calculator, so this updates itself.
What is in the template
Both workbooks carry seven sheets.
- How To Use explains each sheet and lists the formulas behind it.
- Payoff Calculator holds the market inputs, the four leg rows and the ten output rows shown at the top of this article.
- Payoff Table prices the position at 33 underlying levels from $700 to $860, with one column per leg.
- Strategy Library carries the six structures compared above, all wired to the same engine.
- Position Sizing turns account size and a risk percentage into a contract count.
- Leg Detail is the chain snapshot with bid, ask, mid, open interest, implied volatility and the Greeks for every strike used.
- Breakeven Solver shows the segment scan in full, one row per segment.
The sample edition has static values captured on 15 August 2026, with the exact MarketXLS formula printed beside each one. The template edition replaces every one of them with a live formula, so changing the ticker or the expiry rebuilds the whole workbook.
For the visual side of the same problem, the option payoff chart builder plots the curve this calculator describes numerically, including the pre expiry line that sits above the expiry line while time value remains.
Frequently asked questions
How many breakevens can an option position have? As many as it has strikes, in principle. A single naked leg has one. Vertical spreads have one. Straddles, strangles, condors and butterflies have two. Ratio and broken wing structures can have three. The segment scan finds all of them without being told which structure it is looking at, which is why the calculator uses it instead of a lookup table of per strategy formulas.
Why does my broker show a different maximum loss than the calculator? Two common reasons. First, brokers usually add commissions and fees, which this model leaves out so the mechanics stay visible. Second, on structures with an undefined tail such as a naked short put, some platforms show a margin requirement rather than the true worst case. The $37,376.50 in the table above is the arithmetic loss if SPY reaches zero, not a margin figure.
Can the calculator handle a position that includes shares? Yes. The collar row in the comparison table is 100 long shares plus a long put and a short call. Stock is treated as a leg whose value at expiry is the underlying price itself, with no strike, so it slots into the same sum as the option legs.
Should I use the bid, the ask or the mid for premiums? The template uses the mid, because it is the cleanest estimate of fair value and makes structures comparable. Be aware that you will rarely fill every leg at the mid on a four leg order. If you want the conservative version, price the legs you buy at the ask and the legs you sell at the bid, which on this condor moves the credit from $2.81 to $2.77 and widens maximum loss from $1,219 to $1,223.
Does the calculator tell me the probability of profit? Not directly, and that is deliberate. Probability requires a distributional assumption, and the payoff mechanics do not. The breakeven win rate row tells you what probability the structure needs to hold even, which is a fact about the payoff. Comparing that to what you believe the probability actually is remains your judgement.
Does this work on any ticker? Any ticker with a listed option chain. Change the symbol on the calculator sheet and the OptionSymbol calls repoint, so the quotes, Greeks and strike list all follow.
The bottom line
An option payoff calculator earns its place when the position has more than one leg. The single leg case is arithmetic you can do in your head. The multi-leg case has two breakevens, a maximum loss that depends on wing width rather than premium, and a reward to risk ratio that is often the opposite of what the structure feels like from the outside. This condor collects $281 and risks $1,219, and no diagram makes that as clear as the number 0.23 does.
Build it once, wire the legs to live quotes, and every future structure is four rows of typing away from a complete answer.
Explore what else MarketXLS can do at marketxls.com, or book a demo to see the options tooling on your own chain.
Educational content only. Nothing here is investment advice or a recommendation to buy or sell any security.