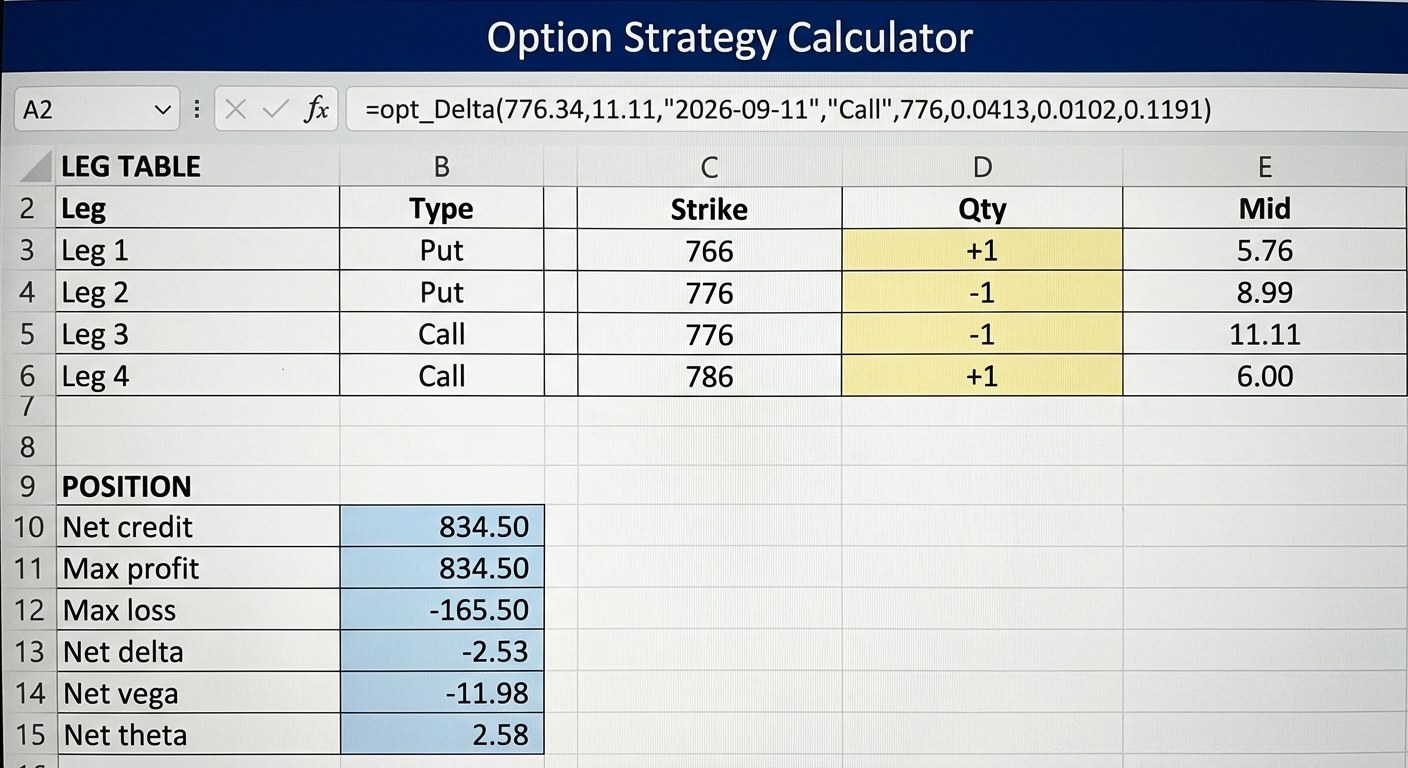
Option strategy calculator work starts with a package, not a contract. You have three or four legs in mind, your platform quoted one net number for the whole thing, and you want to know what that number commits you to before you send the order.
A two-leg spread calculator can answer that with arithmetic. Maximum profit and maximum loss on a vertical spread are fixed functions of two strikes and a premium. Once you go past two legs, that shortcut stops working, and most calculators quietly keep using it anyway.
This guide builds a calculator that is leg-count agnostic. It handles a straddle, a condor, a butterfly, a covered call and a collar with the same engine, because it derives the answers instead of looking them up. Along the way it measures a cost that no payoff diagram shows, and on the chain priced below that cost separates three economically identical positions by a factor of six.
Every figure comes from one live SPY chain captured on August 15, 2026. Two workbooks are linked at the end.
Option Strategy Calculator: Eight Positions From One Chain
All eight positions below were built from the same SPY chain on the same afternoon, with SPY at $776.34 and 27 days to the September 11, 2026 expiry. Every figure is per one contract set, using the 100 share multiplier.
| Strategy | Legs | Net at mid | Net at natural | Slippage | Max profit | Max loss | Breakevens |
|---|---|---|---|---|---|---|---|
| Long straddle | 2 | $2,010.00 debit | $2,022.00 | $12.00 | Unlimited | $2,010.00 | 755.90 / 796.10 |
| Short strangle | 2 | $831.00 credit | $826.00 | $5.00 | $831.00 | Unlimited | 751.69 / 800.31 |
| Iron condor | 4 | $368.00 credit | $360.00 | $8.00 | $368.00 | $632.00 | 756.32 / 795.68 |
| Call butterfly | 3 | $181.50 debit | $319.00 | $137.50 | $818.50 | $181.50 | 767.82 / 784.18 |
| Put butterfly | 3 | $181.50 debit | $290.00 | $108.50 | $818.50 | $181.50 | 767.82 / 784.18 |
| Iron butterfly | 4 | $834.50 credit | $813.00 | $21.50 | $834.50 | $165.50 | 767.65 / 784.35 |
| Covered call | 2 | $77,249.50 debit | $77,252.00 | $2.50 | $1,950.50 | $77,249.50 | 772.50 |
| Collar | 3 | $77,696.00 debit | $77,701.00 | $5.00 | $1,504.00 | $1,696.00 | 776.96 |
Net at mid prices every leg at the midpoint of its bid and ask. Net at natural pays the ask on each long leg and hits the bid on each short leg, which is what a marketable order actually does. Slippage is the gap between them.
Read down the slippage column and one row does not fit. The call butterfly has three legs and costs $137.50 to enter. The iron condor has four legs and costs $8.00. Leg count does not explain that, and the rest of this guide explains what does.
What Every Option Strategy Calculator Gets Right
Credit where it belongs. The standard outputs are correct, and for a two-leg position they are also complete.
Net debit or credit is a signed sum of premiums. Breakeven is where profit crosses zero. Maximum profit and maximum loss on a vertical spread come straight from the strike width. Any calculator that returns those four numbers for a bull call spread is giving you the right answers, and you could check them on paper in under a minute.
The reason to build your own starts where positions get wider. A one-lot vertical has one degree of freedom. An iron condor has four strikes, two credits and two widths, and its risk is not the sum of its parts. The engine below treats every position identically, whether it has two legs or six.
Why Maximum Profit Is Not a Formula
Here is the part most calculators skip.
At expiry, every European option pays its intrinsic value, and intrinsic value is piecewise linear in the underlying price. Add any number of such legs together and the total is still piecewise linear. That gives the payoff a specific shape: straight segments joined at bends, and the bends can only occur at strike prices.
That fact is the whole algorithm. If the payoff is straight between strikes, then no interior maximum or minimum can hide between two strikes. Every finite extreme sits exactly on a strike. So a calculator does not need a formula per strategy. It needs to evaluate the position at every strike and take the highest and lowest results.
The two ends need separate handling:
- The upside. As the underlying rises past the highest strike, the payoff becomes a straight line with a fixed slope. Add up the signed quantities of long stock and every call. If that total is positive, profit runs to infinity. If it is negative, loss does.
- The downside. The underlying cannot fall below zero, so the downside is never truly unbounded. Evaluate the position at a price of zero and treat that as one more candidate point.
That second rule matters more than it sounds. Ask most calculators for the maximum loss on a covered call and they say unlimited or leave it blank, because a naive slope test sees long stock running down forever. The honest answer sits in the table above: $77,249.50, which is what you paid for the shares less the call premium you collected. It is a boundary you will almost certainly never touch, and it is still the correct number, because a covered call carries full downside stock risk.
Breakevens come from the same structure. Walk the segments between consecutive strikes, and wherever profit changes sign across a segment, interpolate the crossing linearly. A butterfly has two. A collar has one. A position can have zero, which is worth knowing before you trade it.
The Entry Cost That No Payoff Diagram Shows
Now back to that call butterfly.
The 766 / 776 / 786 call butterfly and the 766 / 776 / 786 iron butterfly are the same economic position. Put-call parity guarantees it: same strikes, same expiry, same payoff shape. The Greeks confirm it independently. Net delta is -2.83 against -2.53, net gamma -0.2421 against -0.2217, net vega -11.69 against -11.98, net theta $2.29 a day against $2.58. Those are the same position measured twice.
They do not cost the same to enter.
| Butterfly variant | Legs used | Slippage at entry | Share of maximum profit | Max loss at mid | Max loss at natural |
|---|---|---|---|---|---|
| Call butterfly | 766C, 776C x2, 786C | $137.50 | 16.8% | $181.50 | $319.00 |
| Put butterfly | 766P, 776P x2, 786P | $108.50 | 13.3% | $181.50 | $290.00 |
| Iron butterfly | 766P, 776P, 776C, 786C | $21.50 | 2.6% | $165.50 | $187.00 |
Entering the call version instead of the iron version costs $116.00 more, on a position whose best possible outcome is around $820. The maximum loss goes from $181.50 to $319.00, a 75.8% increase, before the underlying has moved at all.
The cause is visible the moment you print the bid to ask width by strike:
| Strike | Call width | Put width |
|---|---|---|
| 750 | $2.04 | $0.03 |
| 760 | $2.67 | $0.05 |
| 766 | $2.46 | $0.10 |
| 776 | $0.10 | $0.14 |
| 786 | $0.09 | $1.79 |
| 792 | $0.05 | $2.71 |
| 802 | $0.03 | $2.72 |
The pattern is clean and it is not noise. In-the-money options quote wide. Out-of-the-money options quote tight. With SPY at $776.34, the 766 call is in the money and quotes $2.46 wide, while the 766 put is out of the money and quotes $0.10 wide. They are economically linked through parity, and one of them is 25 times more expensive to cross.
Market makers behave this way because in-the-money contracts carry more capital per unit of risk and almost nobody needs them. Traders who want that exposure use the out-of-the-money equivalent instead. Liquidity concentrates there, and the in-the-money book goes stale.
So the rule your calculator should encode is not about leg count. It is about which legs you picked:
Build every position from out-of-the-money and at-the-money contracts wherever parity gives you the choice.
That is exactly why the four-leg iron condor entered for $8.00 while the three-leg call butterfly cost $137.50. The condor uses only out-of-the-money strikes. The butterfly reached into the in-the-money call book for one leg and paid for it.
A calculator that reports leg count without reporting the width you have to cross is measuring the wrong thing.
Net Greeks Are Where a Strategy Calculator Earns Its Keep
Greeks add linearly across legs, weighted by signed quantity. That part is simple, and it is the one aggregation a spreadsheet does perfectly.
| Strategy | Net delta | Net gamma | Net vega | Net theta per day |
|---|---|---|---|---|
| Long straddle | 8.01 | 3.1532 | $167.49 | -$37.26 |
| Short strangle | -2.28 | -2.5964 | -$138.56 | $31.18 |
| Iron condor | -5.21 | -0.7310 | -$35.87 | $7.20 |
| Call butterfly | -2.83 | -0.2421 | -$11.69 | $2.29 |
| Iron butterfly | -2.53 | -0.2217 | -$11.98 | $2.58 |
| Covered call | 72.22 | -1.4742 | -$70.78 | $15.91 |
| Collar | 46.71 | -0.3520 | -$2.99 | $0.64 |
Three readings from that table are worth more than the payoff diagram.
The wings on a condor are expensive in decay, not just in premium. Compare the short strangle to the iron condor. Buying the two protective wings converts an unlimited loss into a capped $632.00, which is the reason to do it. It also cuts net vega from -$138.56 to -$35.87, a 74.1% reduction, and net theta from $31.18 a day to $7.20, a 76.9% reduction. The strangle collects premium 4.3 times faster. You are paying roughly three quarters of your decay to buy the tail, and that trade is defensible, but it should be a decision rather than a surprise.
A covered call is not a 100 delta position. Net delta is 72.22, because the short 792 call carries about -27.8 delta against the 100 delta of the stock. If you hedge a covered call as though it were 100 shares of exposure, you are over-hedged by more than a quarter from the day you open it. Net gamma is also negative, which means that delta falls further as the underlying rises.
The collar is close to volatility neutral. Net vega of -$2.99 on a position that cost $77,696.00 to open is effectively zero. The long put and the short call nearly cancel, so a general repricing of implied volatility barely moves the position. Net theta of $0.64 a day says the same thing from the decay side. That is the actual character of a collar, and no payoff diagram communicates it.
Calibrate the Forward Before You Trust Any Greek
Every Greek in that table depends on implied volatility, and implied volatility depends on getting the forward price right. This step is cheap, and skipping it corrupts everything downstream.
Do not use the implied volatility column your data vendor ships. Vendors typically solve it from the last traded price under an undisclosed forward, and last trades go stale at exactly the strikes with wide markets. The result fails a test it cannot fail if it is right.
At any single strike and expiry, the call and the put must imply the same volatility. They are linked by put-call parity, so two different volatilities at one strike is an arbitrage that does not exist.
| Strike | Re-solved call IV | Re-solved put IV | Gap | Vendor call IV | Vendor put IV | Vendor gap |
|---|---|---|---|---|---|---|
| 750 | 14.5264% | 14.8149% | 0.29 | 18.0916% | 13.9932% | 4.10 |
| 760 | 13.7235% | 13.5487% | 0.17 | 16.9228% | 12.6565% | 4.27 |
| 766 | 13.1121% | 12.8602% | 0.25 | 15.8089% | 11.9180% | 3.89 |
| 776 | 11.9142% | 11.9142% | 0.00 | 12.8106% | 10.7644% | 2.05 |
| 786 | 11.1155% | 11.3533% | 0.24 | 11.7532% | 10.7950% | 0.96 |
| 792 | 10.7688% | 11.3689% | 0.60 | 11.2710% | 11.1795% | 0.09 |
| 802 | 10.3967% | 12.2288% | 1.83 | 10.7553% | 11.6586% | 0.90 |
The vendor column disagrees with itself by an average of 2.32 volatility points across these seven strikes, and by 4.27 points at the 760 strike. Re-solving from the mids under a calibrated forward cuts the average gap to 0.48 points, and at the 776 strike the two sides agree to sixteen decimal places.
The procedure is three steps:
- Solve the forward from parity. Pick the strike closest to spot that has a real two-sided market in both the call and the put. Then the forward is the strike plus the call mid less the put mid, divided by the discount factor. On this chain the 776 strike gave a forward of $778.1265.
- Back out the carry. Rearranging the forward relationship gives a dividend yield of 1.0228% against a risk free rate of 4.13%. SPY's headline yield that afternoon was 1.01%, so the two are close here, which is reassuring rather than guaranteed.
- Re-solve every leg from its own mid. Bisection on the Black-Scholes price converges in well under a second per leg.
Two free checks tell you whether it worked. Cross-check the forward at a second dual-listed strike: the 777 strike solved to $778.1084, agreeing with the 776 strike to under two cents. Then confirm that the call and put at your anchor strike solve to an identical volatility, which they did at 11.9142%.
One honest caveat. The gap in the re-solved column widens to 1.83 points at the 802 strike, where the put is deep in the money and quotes $2.72 wide. When the market is that wide, the midpoint is itself an estimate, and no calibration repairs a quote nobody is standing behind. Treat re-solved volatility from a wide market as indicative, and prefer the liquid side of the strike.
Building the Option Strategy Calculator in Excel
The template workbook is a leg table plus two aggregation blocks. Every leg is one row, and the position formulas never change no matter how many rows you fill.
Start by building the contract symbol each leg needs:
=OptionSymbol($B$5,$B$6,B17,C17)
OptionSymbol takes the underlying, the expiry date, the option type and the strike, and returns the contract symbol that every contract-level function expects. Feed that symbol to the quote functions:
=Bid(E17)
=Ask(E17)
=QM_OpenInterest(E17)
Open interest belongs on the leg row, not in a footnote. It is your early warning that a leg sits in the stale part of the book, which is what produced the $137.50 butterfly above.
The underlying price and the carry input come from:
=QM_Last("SPY")
=DividendYield("SPY")
With a mid price in hand, solve the leg volatility and then the Greeks:
=opt_ImpliedVolatility($B$10,H17,$B$6,B17,C17,$B$7,$B$8)
=opt_Delta($B$10,H17,$B$6,B17,C17,$B$7,$B$8,I17)
=opt_Gamma($B$10,H17,$B$6,B17,C17,$B$7,$B$8,I17)
=opt_Vega($B$10,H17,$B$6,B17,C17,$B$7,$B$8,I17)
=opt_Theta($B$10,H17,$B$6,B17,C17,$B$7,$B$8,I17)
Note the argument order, because it catches people out. The Greek functions take the spot price, the market option price, the expiry, the option type and the strike, then the risk free rate, then the dividend yield, and only then the volatility. The dividend yield sits between the rate and the volatility, and passing your volatility into the yield slot returns a plausible looking number that is wrong.
Aggregate the position with signed quantities:
=SUMPRODUCT($D$17:$D$22,$H$17:$H$22)*$B$9
=SUMPRODUCT($D$17:$D$22,$J$17:$J$22)*$B$9
The first line is net debit or credit at mid. The second is net delta. Net gamma, vega and theta are the same pattern against their own columns. Setting a leg quantity to zero removes it from every total at once, which is how you compare a strangle against a condor without rebuilding anything.
To browse the chain before committing to strikes:
=Expirations("SPY")
=Strikes("SPY","2026-09-11")
The payoff sheet applies the kink logic across a grid of underlying prices and reports the maximum, the minimum and the nearest breakeven. One caution is built into the sheet itself: a grid only reports the extremes it can actually see. A 61 point grid across a 30% range steps roughly $4 at a time, which can walk straight past the peak of a butterfly whose strikes are $10 apart. Widen the range or shrink the step when strikes sit close together, or evaluate at the strikes directly, which is what the sample workbook does.
Choosing the Right Approach
A dedicated web calculator is faster for a single position you will never revisit. It is already built, it needs no add-in, and for a one-lot vertical the answer it gives is the right one.
Build your own when any of these apply. You compare several structures on the same chain and want them priced from one consistent snapshot. You care about the entry cost as much as the payoff. You want net Greeks for a position rather than per leg. You want to keep a record of what the chain looked like when you decided, which a spreadsheet does for free and a web tool does not.
The honest limitation is that this model prices European exercise. That is correct for cash-settled index options such as SPX. American options on ETFs and single names carry an early exercise premium that Black-Scholes does not capture, and that premium is largest on in-the-money puts and on calls into a dividend. Those are the same contracts that quote widest, so the two effects compound. Prefer the out-of-the-money side for that reason as well.
Download the Option Strategy Calculator
Two workbooks, both built from the chain used throughout this guide:
- Static Version (with MarketXLS formula reference) is pre-filled with the August 15, 2026 SPY data. It holds all eight strategies, every leg with its own quotes and Greeks, a payoff grid from $700 to $850, and the re-solved volatility by strike.
- MarketXLS Formula Version contains the live leg table, the position aggregation block and the payoff sheet. Edit the yellow cells only.
The formula version needs the MarketXLS add-in to pull live data. The static version opens in any copy of Excel.
Frequently Asked Questions
How do you calculate the maximum profit on a multi-leg option strategy?
Evaluate the position at every strike in it, and also at an underlying price of zero, then take the highest result. Because the expiry payoff is piecewise linear with bends only at strikes, no maximum can hide between two strikes. Then check the upside slope by summing the signed quantities of long stock and all calls. If that sum is positive, the maximum profit is unlimited instead.
Why does my option strategy calculator show a different net price than my broker?
Almost certainly because it prices at the mid and your broker filled you at the natural. On the eight positions above, that gap ranged from $2.50 on a covered call to $137.50 on a call butterfly. Price your legs at the ask when buying and at the bid when selling to see what a marketable order actually costs.
Is an iron butterfly better than a call butterfly?
They are the same position, so neither is better on payoff. They differ on execution. On this chain the call butterfly cost $137.50 to enter against $21.50 for the iron butterfly, because the call version needs an in-the-money leg that quoted $2.46 wide while every iron butterfly leg quoted under $0.15 wide. When put-call parity gives you a choice of construction, pick the one built from out-of-the-money contracts.
What is the real maximum loss on a covered call?
The full purchase price of the shares less the premium you collected, which is $77,249.50 on the position above. Calculators that report unlimited or leave it blank are applying a slope test that ignores the fact that a share price stops at zero. The number is a boundary rather than a likely outcome, and a covered call still carries every dollar of downside stock risk below the breakeven of $772.50.
Why do the Greeks on my position not match my platform?
Check the volatility input first. If you passed a vendor implied volatility column into a Black-Scholes function, you combined a volatility solved under one forward with a model using another. On this chain the vendor volatilities disagreed with themselves by up to 4.27 points at a single strike. Re-solve implied volatility from each leg's own mid under a forward calibrated from put-call parity, then confirm that the call and put at your anchor strike agree.
How many legs can this calculator handle?
As many as you add rows for. The engine sums signed quantities and scans the strikes, so nothing in it is specific to two legs or four. The template ships with six leg rows, and copying the formulas down extends it without any change to the position totals.
The Bottom Line
An option strategy calculator that returns net price, breakeven, maximum profit and maximum loss is answering the easy half of the question, and for a two-leg spread the easy half is the whole question. Past two legs it stops being enough.
Maximum profit and maximum loss on a multi-leg position are not formulas to look up. They are extremes to find, and the payoff geometry tells you exactly where to look: at the strikes, at zero, and in the slope of the upper tail. Encode that once and the calculator stops caring how many legs you give it.
The cost that decides how these positions actually perform is not on the payoff diagram either. Three butterflies with identical strikes, identical expiry and Greeks that match to two decimal places cost $137.50, $108.50 and $21.50 to enter, and the only difference between them is whether the construction reaches into the in-the-money book. That is a 16.8% bite out of maximum profit on one version and a 2.6% bite on another, decided entirely by a choice most calculators do not even present.
Both problems are solvable from data already on your screen. Calibrate the forward from parity, re-solve volatility from the mids, scan the payoff at the kinks, and print the bid to ask width next to every leg.
Nothing here is a recommendation to buy or sell any security. Every figure is a snapshot of one chain on one afternoon, shown to make the method reproducible rather than to suggest a trade. Multi-leg option positions can lose their entire capital at risk, and the covered call and collar above carry the full downside of the underlying shares.
Build it once, and the next position is a leg table and a glance.
- MarketXLS brings live option chains, Greeks and implied volatility into Excel.
- Book a demo to see the option functions used in this guide running on a live chain.