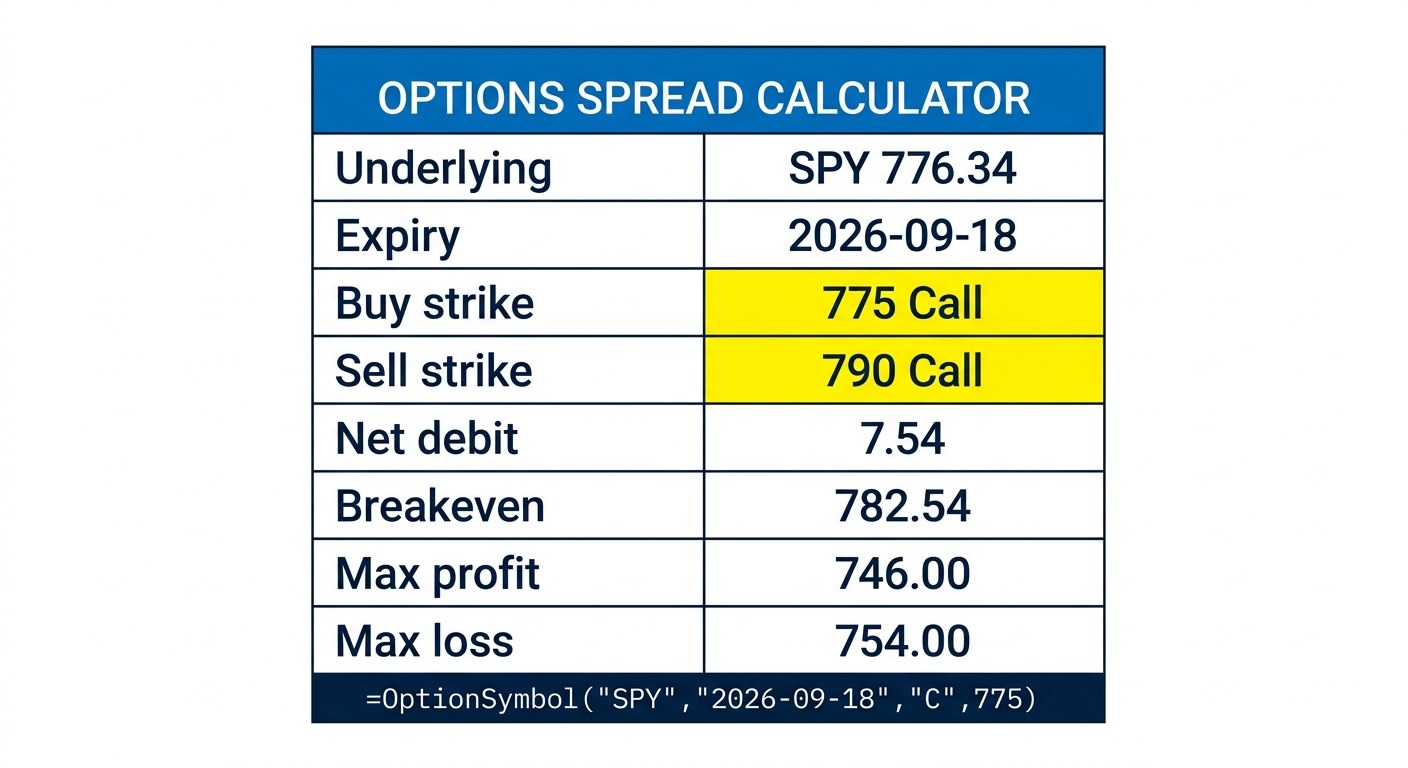
Options spread calculator inputs look like two strikes and one net price, and that is exactly where the trouble hides. You picked the strikes, the platform quoted the net, and the quote says nothing about how far the underlying has to move, what the worst case actually costs, or whether the second leg is earning the profit it gives away.
Every spread calculator on the internet will answer the first three questions. Net debit, breakeven, maximum profit, maximum loss. Those four figures are arithmetic on two strike prices and a premium, and they take about ten seconds to derive by hand.
This guide builds a calculator that answers a harder question: what does the spread cost you that the four standard outputs do not show? There are two such costs, both measurable, and on the real chain priced below they are larger than most traders expect. The first is the gap between the mid price every calculator uses and the price you can actually transact at. The second is volatility skew, which quietly decides how much the protective leg costs you at entry and how much it takes back from you every day you hold.
Every figure below comes from one live SPY chain captured on August 15, 2026. Two workbooks are linked at the end.
Options Spread Calculator: Four Vertical Spreads Side by Side
A vertical spread is two options on the same underlying with the same expiry and two different strikes. There are exactly four of them. Here are all four, built from the same SPY chain on the same afternoon, with SPY at $776.34 and 34 days to the September 18, 2026 expiry.
| Measure | Bull call debit | Bear call credit | Bull put credit | Bear put debit |
|---|---|---|---|---|
| Buy strike | 775 call | 800 call | 760 put | 775 put |
| Sell strike | 790 call | 790 call | 770 put | 765 put |
| Width | $15.00 | $10.00 | $10.00 | $10.00 |
| Net at mid | $7.46 debit | $2.97 credit | $2.70 credit | $3.32 debit |
| Net, marketable | $7.54 debit | $2.92 credit | $2.66 credit | $3.37 debit |
| Maximum profit | $746.00 | $292.00 | $266.00 | $663.00 |
| Maximum loss | $754.00 | $708.00 | $734.00 | $337.00 |
| Breakeven | $782.54 | $792.92 | $767.34 | $771.63 |
| Move required | +0.80% | +2.14% | -1.16% | -0.61% |
| Risk to reward | 0.99 | 0.41 | 0.36 | 1.97 |
| Net as percent of width | 50.3% | 29.2% | 26.6% | 33.7% |
Read the last two rows together, because they are the ones that compare spreads honestly.
Risk to reward looks brutal on the credit spreads. The bull put spread risks $734 to make $266. That is not a defect. A credit spread is paid to be right about a wider range of outcomes, and it collects that pay by accepting a worse ratio. The bear put debit spread has the best ratio on the board at 1.97, and it also needs the underlying to fall before it makes anything at all.
Net as percent of width is the only figure that compares spreads of different widths on the same scale. The bull call spread costs 50.3% of its width, which is close to the definition of a coin flip on a spread whose strikes straddle the money. The two credit spreads take in 29.2% and 26.6%. Hold onto that second pair. The rest of this guide is largely about why those two numbers are not equal when they look like they should be.
What an Options Spread Calculator Has to Compute
Six outputs, from five inputs. The inputs are the two strikes, the two premiums and the contract count. Everything else follows.
| Output | Formula | Bull call 775/790 |
|---|---|---|
| Width | Higher strike minus lower strike | $15.00 |
| Net cost | Long premium minus short premium | $7.54 debit |
| Maximum loss | Debit paid, or width minus credit | $754.00 |
| Maximum profit | Width minus debit, or credit received | $746.00 |
| Breakeven | Long strike plus debit, on a call debit spread | $782.54 |
| Capital at risk | Maximum loss times 100 times contracts | $754.00 |
Two properties of that table are worth stating plainly, because they are the entire reason spreads exist.
Maximum profit and maximum loss always sum to the width. On the 775/790 call spread, $746 plus $754 equals $1,500, which is the 15 point width times 100. The width is a fixed pot. The premium decides how it gets divided, and nothing the underlying does can change the size of the pot.
Both ends are capped. A vertical spread cannot lose more than the figure above and cannot make more than the figure above. That is the trade: you give up the tail in exchange for a known worst case.
The Mid Price Problem
Type two strikes into any free spread calculator and it will price them at the mid, the average of bid and ask. The mid is a quote. It is not a fill.
To open the 775/790 call spread you buy the 775 call at its ask of $13.54 and sell the 790 call at its bid of $6.00. That is a net debit of $7.54. Price the same spread at the mid of each leg and you get $13.495 minus $6.035, or $7.46.
Eight cents. Here is what those eight cents do.
| Priced at mid | Priced marketable | |
|---|---|---|
| Net debit | $7.46 | $7.54 |
| Maximum profit | $7.54 | $7.46 |
| Maximum loss | $7.46 | $7.54 |
| Breakeven | $782.46 | $782.54 |
| Risk to reward | 1.01 | 0.99 |
The spread crosses from making slightly more than it risks to risking slightly more than it makes, entirely on the fill. Nothing about the market changed. Only the price you were honest about changed.
Eight cents is $8 per contract, which is 0.53% of the width and 1.06% of the maximum profit the mid-price version advertised. On a spread you plan to close before expiry, you pay a version of that cost twice. A spread calculator that cannot show you this number is not modelling the trade you are about to place. That is why both strikes in the template pull a bid and an ask separately rather than a single price.
Building the Options Spread Calculator in Excel
Every option formula in MarketXLS needs a contract symbol first. OptionSymbol builds it from four arguments.
=OptionSymbol($B$5, $B$6, $B$7, $B$8)
In the template, B5 holds the ticker, B6 the expiry, B7 the option type and B8 the long strike. That formula returns the QuoteMedia contract symbol, and every leg-level function takes it. Put the long leg in row 16 and the short leg in row 17, and the calculator is a handful of formulas.
=QM_Bid($B$16)                  Live bid on the leg
=QM_Ask($B$16)                  Live ask on the leg
=QM_Last($B$16)                 Last trade on the leg
=QM_OpenInterest($B$16)         Open interest, the liquidity check
=OPT_DaysToExpiration($B$16)    Calendar days left on both legs
=QM_Last($B$5)                  The underlying
The spread outputs are then plain arithmetic on those cells.
Width            =ABS($B$8-$B$9)
Net at mid       =E16-E17
Net, marketable  =D16-C17
Slippage         =B25-B24
Maximum profit   =IF(B25>0, B23-B25, -B25)*$B$10*100
Maximum loss     =IF(B25>0, B25, B23+B25)*$B$10*100
Breakeven        =IF($B$7="C", MIN($B$8,$B$9)+ABS(B25), MAX($B$8,$B$9)-ABS(B25))
The IF on the net cost is what makes one sheet handle all four verticals. A positive net is a debit and the maximum loss is the debit. A negative net is a credit and the maximum loss is the width minus that credit.
For the Greeks, the opt_ family takes eight arguments in a fixed order: current stock price, market option price, expiry date, option type, strike price, risk free rate, dividend yield and sigma. The dividend yield sits between the rate and sigma, which is the argument most often passed in the wrong slot.
=opt_Delta($B$21, E16, $B$6, $B$7, $B$8, $B$11, $B$12)
=opt_Gamma($B$21, E16, $B$6, $B$7, $B$8, $B$11, $B$12)
=opt_Theta($B$21, E16, $B$6, $B$7, $B$8, $B$11, $B$12)
=opt_Vega($B$21, E16, $B$6, $B$7, $B$8, $B$11, $B$12)
=opt_ImpliedVolatility($B$21, E16, $B$6, $B$7, $B$8, $B$11, $B$12)
B21 is the underlying price, E16 the leg mid, B11 the risk free rate and B12 the carry.
Leave sigma empty on opt_ImpliedVolatility and MarketXLS solves for it from the option price you passed. A spread Greek is then just the long leg value minus the short leg value.
Calibrating the Model Before You Trust It
This step is skipped by nearly every spread calculator, and skipping it is why model numbers so often disagree with the screen.
A Black-Scholes model needs a forward price, not just a spot price. The forward depends on the dividend the underlying pays between now and expiry and on the financing rate. Guess it wrong and every model output drifts.
You do not have to guess. Put-call parity gives you the forward directly from the chain you are already looking at. At the 775 strike the call mid is $13.495 and the put mid is $10.760.
Forward = Strike + (Call mid - Put mid) / e^(-rT)
        = 775 + (13.495 - 10.760) / 0.996281
        = 777.745
With SPY at $776.34, that forward implies a carry of 2.06% annualized, not the 1.01% headline dividend yield. Using the headline figure would have mispriced the model against the market.
The 780 strike, where both a call and a put also trade, independently solves to a forward of $777.63. Two strikes agreeing to within twelve cents is the confirmation that the number is real.
Once you feed that forward back in and re-solve implied volatility from each mid price, the model reprices every quote on the chain exactly. It also produces a clean validation: the 775 call and the 775 put both solve to an implied volatility of 12.83%. They have to. Put-call parity guarantees a call and a put at the same strike carry the same implied volatility, so if your calculator returns two different numbers there, the forward is wrong. That single check catches more modelling errors than any other.
Volatility Skew Is the Price of the Second Leg
Here is the SPY September 18 chain, with implied volatility re-solved from every mid price against the calibrated forward.
| Strike | Call IV | Put IV | Distance from spot |
|---|---|---|---|
| 760 | 14.20% | -2.11% | |
| 765 | 13.69% | -1.46% | |
| 770 | 13.22% | -0.82% | |
| 775 | 12.83% | 12.83% | -0.17% |
| 780 | 12.37% | 12.49% | +0.47% |
| 785 | 11.98% | +1.12% | |
| 790 | 11.66% | +1.76% | |
| 795 | 11.38% | +2.41% | |
| 800 | 11.17% | +3.05% |
Implied volatility falls steadily as strikes rise. This is ordinary equity index skew: downside protection is bid up, upside is not.
Now apply it to a spread. Every vertical buys one option to cap the risk of the option it sells. That protective wing is priced at a different implied volatility than the leg you sold, and the direction of the difference depends entirely on which side of the chain you are on.
| Credit spread | Sold leg IV | Bought wing IV | Wing gap | Credit | Credit as percent of width |
|---|---|---|---|---|---|
| 790/800 call | 11.66% | 11.17% | -0.49 points | $2.92 | 29.2% |
| 770/760 put | 13.22% | 14.20% | +0.97 points | $2.66 | 26.6% |
Both spreads are 10 points wide. Both short legs sit within two percent of spot. And the put spread's short leg is actually closer to the money than the call spread's: the 770 put is 0.82% below spot while the 790 call is 1.76% above it.
By the usual intuition the put spread should collect more. It collects less.
The reason is the wing. On the call side, skew falls as you move up, so the 800 call you buy for protection is 0.49 volatility points cheaper than the 790 call you sold. Skew is paying you to buy protection. On the put side, skew rises as you move down, so the 760 put you buy is 0.97 volatility points more expensive than the 770 put you sold. Skew is charging you for it.
On a single option, skew is a curiosity. On a spread, skew is the price of the second leg, and it is the difference between collecting 29.2% of width and collecting 26.6%.
The Same Skew Takes Your Theta Too
Credit spreads are described as positive theta positions, which is true and not very useful. Look at what the two 10-wide credit spreads actually earn per day.
| Credit spread | Short leg theta | Long wing theta | Net theta per day | Decay retained |
|---|---|---|---|---|
| 790/800 call | -$16.12 | -$11.98 | +$4.14 | 25.7% |
| 770/760 put | -$15.98 | -$15.63 | +$0.35 | 2.2% |
The short legs decay at almost the same rate, about $16 a day each. The difference is entirely in the wing.
The 800 call you bought loses $11.98 a day, so you keep 25.7% of what the short leg earns you. The 760 put you bought loses $15.63 a day, which is 97.8% of what its short leg earns. Net, the put credit spread collects thirty five cents a day. It is a positive theta position in the same sense that a leaking bucket is a container.
The cause is the same skew from the previous section. Higher implied volatility means more time value in the contract, and more time value means more to lose per day. The 760 put carries a 14.20% IV against the 770 put's 13.22%, so the wing you bought for protection is bleeding at nearly the rate of the leg you sold.
This is the sense in which skew charges you twice on a put credit spread. Once at entry, in a smaller credit. Then every day you hold, in decay you do not keep. Neither cost appears anywhere in net debit, breakeven, maximum profit or maximum loss.
The Payoff, and Why Before Expiry Looks Different
Here is the 775/790 call spread at expiry, at a $7.54 debit.
| SPY at expiry | Long 775 value | Short 790 value | P/L per contract |
|---|---|---|---|
| $760.00 | $0.00 | $0.00 | -$754.00 |
| $770.00 | $0.00 | $0.00 | -$754.00 |
| $775.00 | $0.00 | $0.00 | -$754.00 |
| $777.50 | $2.50 | $0.00 | -$504.00 |
| $782.54 | $7.54 | $0.00 | $0.00 |
| $787.50 | $12.50 | $0.00 | +$496.00 |
| $790.00 | $15.00 | $0.00 | +$746.00 |
| $800.00 | $25.00 | $10.00 | +$746.00 |
Three prices define the whole structure. At or below $775 both legs expire worthless and you lose the full debit. At $782.54 the long leg is worth exactly what you paid. At or above $790 both legs are in the money and the width minus the debit is yours.
That is expiry. Before expiry the picture is different in a way that matters if you plan to close early.
| SPY price | 34 days left | 21 days left | 10 days left | At expiry |
|---|---|---|---|---|
| $750.00 | $2.65 | $1.55 | $0.44 | $0.00 |
| $770.00 | $6.16 | $5.26 | $3.82 | $0.00 |
| $780.00 | $8.21 | $7.81 | $7.21 | $5.00 |
| $790.00 | $10.17 | $10.28 | $10.70 | $15.00 |
| $800.00 | $11.82 | $12.27 | $13.18 | $15.00 |
These are spread marks, not profits. You paid $7.54.
Read the $790 row. The underlying is sitting exactly at the short strike, the position is at its maximum profit target, and the spread marks at $10.17 against a $15.00 width. That is 68% of what the trade is worth at expiry. With ten days left it is still only $10.70.
The short leg is the reason. It holds time value until it expires, and you are short that time value. A debit spread does not reach full width early no matter how right you are about direction. If your plan involves closing at a profit target, the profit target has to be set against this table, not against the payoff diagram.
The bottom row of the same table gives the consolation. At $750, deeply wrong, the spread still marks at $2.65 with 34 days left, against zero at expiry. The cap on your loss arrives at expiry too.
Net Greeks of a Spread
| Greek | Long 775 call | Short 790 call | Net spread |
|---|---|---|---|
| Delta | 0.543 | 0.336 | 0.207 |
| Gamma | 0.01302 | 0.01319 | -0.00016 |
| Theta per day | -$19.78 | -$16.12 | -$3.66 |
| Vega per point | $93.78 | $86.33 | $7.45 |
| Rho per 1% | $37.99 | $23.74 | $14.25 |
Selling the 790 call removes 62% of the delta, 92% of the vega and 82% of the theta cost. That is what the second leg is for, and it is also what the second leg takes away.
Net gamma is roughly zero, and marginally negative. The short 790 call has slightly more gamma than the long 775 call, despite being further from the money, because its implied volatility is lower and lower volatility concentrates gamma near the strike. The practical consequence is that this spread's delta of 0.207 barely moves for small moves in SPY. It behaves like 21 shares of stock and keeps behaving like 21 shares.
Vega is worth a note. The net vega of $7.45 is small enough to ignore, which is exactly the point of a spread. Compare the outright 775 call at $93.78 per volatility point. Buy the call alone and you have taken a large position in implied volatility whether you meant to or not.
What Is Inside the Template
Seven sheets, all driven from the yellow input cells on the calculator sheet.
How To Use explains each sheet and defines width, net debit, net credit, mid price, marketable price, breakeven and capital at risk.
Spread Calculator is the main sheet. Yellow cells for ticker, expiry, option type, both strikes, contract count, rate and carry. It pulls a live bid, ask and open interest for each leg and returns net cost at mid, net cost marketable, the slippage between them, debit or credit, maximum profit, maximum loss, breakeven, the move required, risk to reward, net as percent of width, and capital at risk.
Payoff Table gives profit and loss per share and per contract across a price ladder that spans both strikes, with the breakeven row highlighted.
Four Verticals builds all four spreads from the same chain side by side, the table that opens this guide.
Greeks And Scenarios shows leg and net Greeks, then the mark to market grid across price and time reproduced above.
Skew And Wing Cost carries the implied volatility curve by strike and measures the wing gap in volatility points on each credit spread.
Formula Reference lists every MarketXLS function used, with exact argument order.
Download the templates:
- Static Version (with MarketXLS formula reference) is pre-filled with the August 15, 2026 SPY data used throughout this guide. Hover any bordered cell to see the formula behind it.
- MarketXLS Formula Version contains the live formulas and reprices whenever Excel recalculates.
The formula version needs the MarketXLS add-in to pull live data. The static version opens in any copy of Excel.
Frequently Asked Questions
How do you calculate an options spread?
Take the premium of the option you bought and subtract the premium of the option you sold. A positive result is a net debit that you pay. A negative result is a net credit that you receive. The distance between the strikes is the width, and maximum profit plus maximum loss always equals that width times 100 per contract.
What is the breakeven on a vertical spread?
On a call spread, add the net debit to the lower strike, or add the net credit to the short strike on a credit spread. On a put spread, subtract instead. The 775/790 call spread at a $7.54 debit breaks even at $782.54, which needs SPY to rise 0.80% in 34 days.
Should I use the mid price or the bid and ask in a spread calculator?
Use the bid and the ask. Buy the long leg at its ask and sell the short leg at its bid. On the worked example that difference is eight cents, which is enough to move risk to reward from 1.01 to 0.99. Mid prices tell you where the market is quoted, not where you can transact.
Why does my credit spread collect less premium than a similar one on the other side?
Volatility skew. Implied volatility on an equity index rises as strikes fall, so the protective wing on a put credit spread is priced at a higher volatility than the leg you sold, while the wing on a call credit spread is priced lower. In the chain above that gap is 0.97 volatility points against the put spread and 0.49 points in favour of the call spread.
Why is my debit spread not at maximum profit when the stock is above the short strike?
Because the short leg still holds time value and you are short it. With SPY at the 790 short strike and 34 days remaining, the 775/790 spread marks at $10.17 against a $15.00 width. A debit spread converges to its full width only as expiry approaches.
Is a credit spread better than a debit spread?
Neither is better. They are different distributions of the same fixed pot. A credit spread wins more often and loses more when it loses, and a debit spread does the reverse. Compare them with net as a percent of width, which is the only figure that is comparable across different widths.
The Bottom Line
An options spread calculator that returns net debit, breakeven, maximum profit and maximum loss is doing arithmetic you could do on paper. The four figures are correct and they are not sufficient.
The two costs that decide how a spread actually performs sit outside those four numbers. The bid to ask spread on two legs turned a 1.01 risk to reward into 0.99 before the market moved at all. Volatility skew handed one 10-wide credit spread a 29.2% credit and the other only 26.6%, then took 97.8% of the decay back from the second one every day it was held. Neither cost shows up on a payoff diagram.
Both are measurable, and both are measurable from data you already have on screen. Calibrate the forward from put-call parity, re-solve implied volatility from the mids, and the spread tells you what it costs.
Nothing here is a recommendation to buy or sell any security. Every figure is a snapshot of one chain on one afternoon, shown to make the method reproducible rather than to suggest a trade. Spreads can lose their entire capital at risk.
Build it once and every future spread is five inputs and a glance.
- MarketXLS brings live option chains, Greeks and implied volatility into Excel.
- Book a demo to see the option functions used in this guide running on a live chain.